
Do you want to monitor your Synology NAS in an easy and professional way? This guide walks you through the steps to create a dashboard in Grafana to display system metrics for your Synology NAS server, monitored by Prometheus. The people that have contributed to this guide are Lyxon from the Synology Discord Group and me, Marius from mariushosting.com
If you want to add more NAS devices metrics to your Grafana dashboard installed on your main NAS, you need to follow my second guide: Grafana and Prometheus Dashboard Part 2.
STEP 1
Please Support My work by Making a Donation.
STEP 2
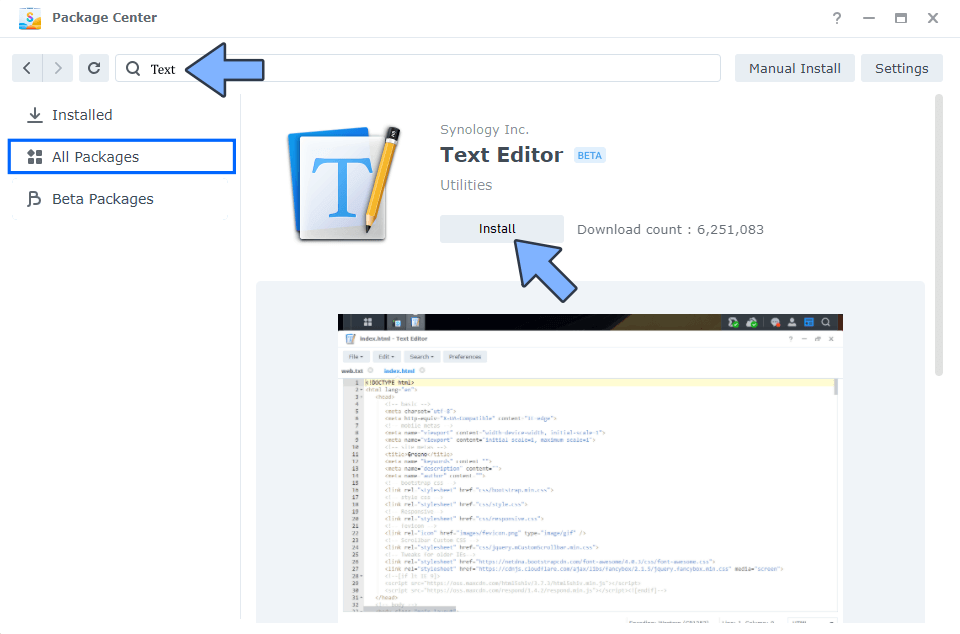
Install Text Editor via Synology “Package Center”. (Mandatory STEP.) If you already have Text Editor installed on your Synology NAS, skip this STEP.
STEP 3
Install Portainer using my step by step guide. If you already have Portainer installed on your Synology NAS, skip this STEP. Attention: Make sure you have installed the latest Portainer version.
STEP 4
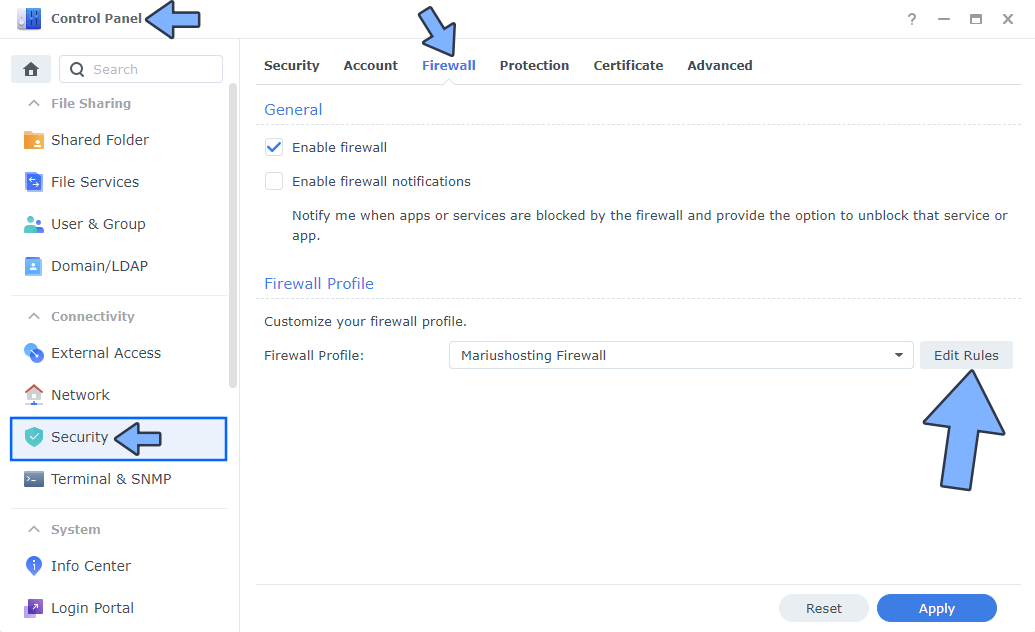
Firewall Setup: If your Synology NAS Firewall is deactivated, Skip the guide from STEP 4 to STEP 12. If your Synology NAS Firewall is activated, go to Control Panel / Security / Firewall tab then click Edit Rules on your current Firewall profile. Follow the instructions in the image below.
STEP 5
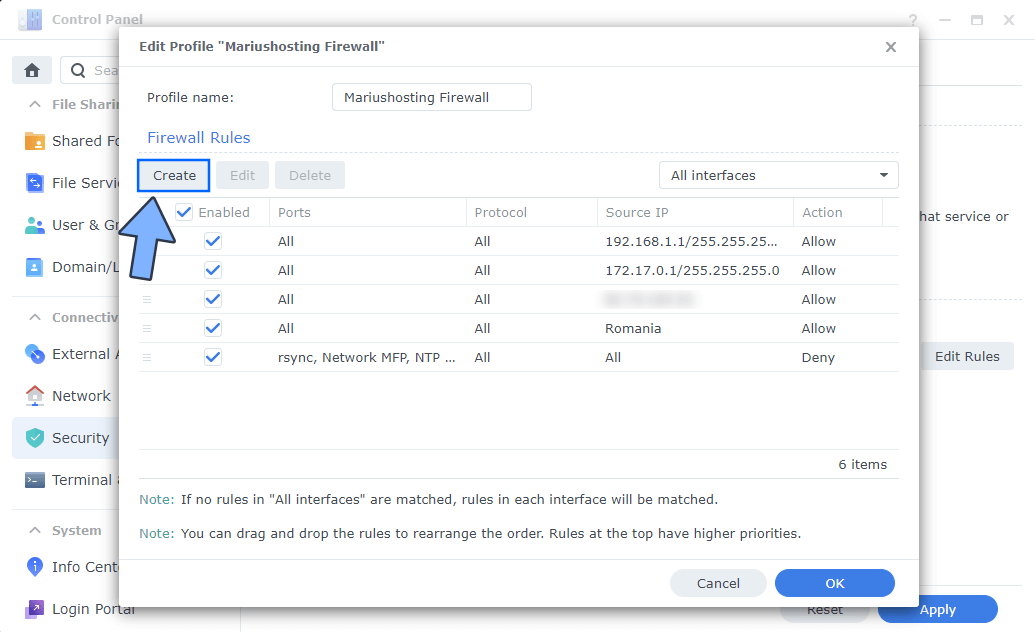
A new window will open click Create. Follow the instructions in the image below.
STEP 6
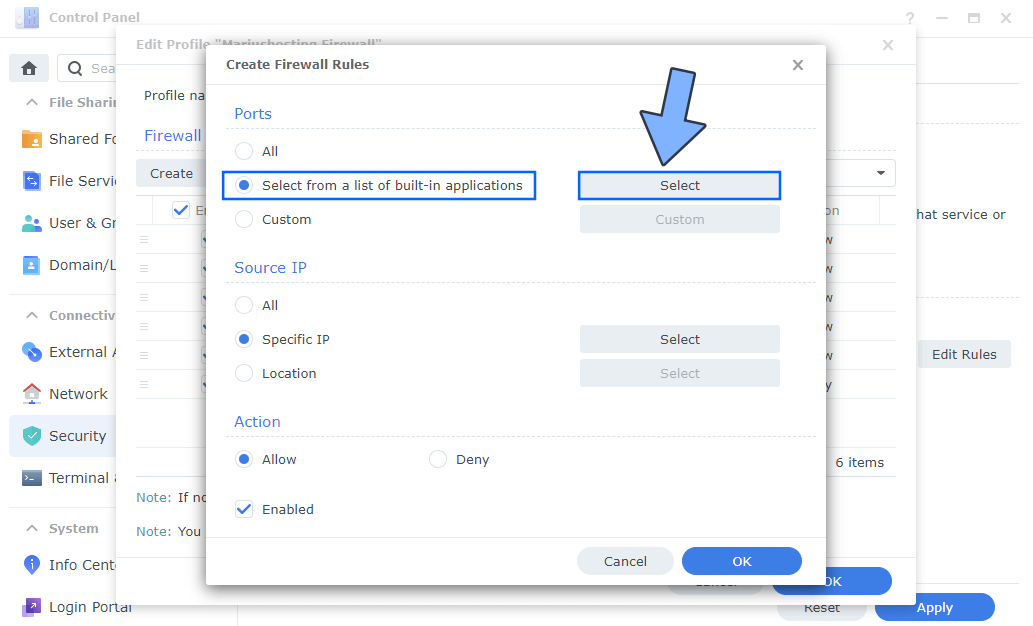
After you click Create at STEP 5 a new window will open. Choose “Select from a list of built-in applications” then click Select. Follow the instructions in the image below.
STEP 7
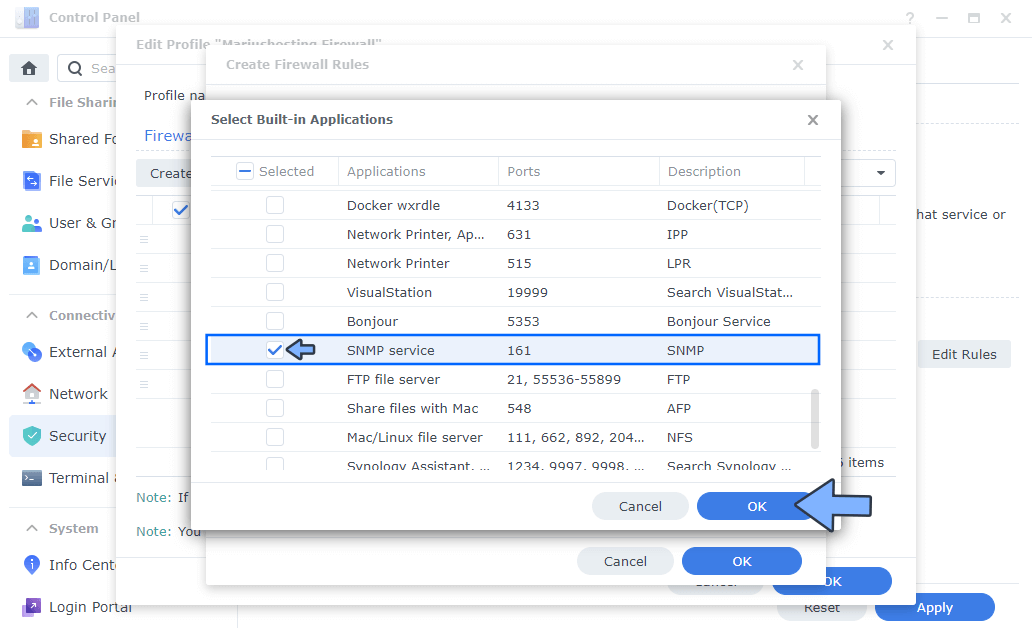
From the Built-in Applications, check SNMP service then click OK. Follow the instructions in the image below.
STEP 8
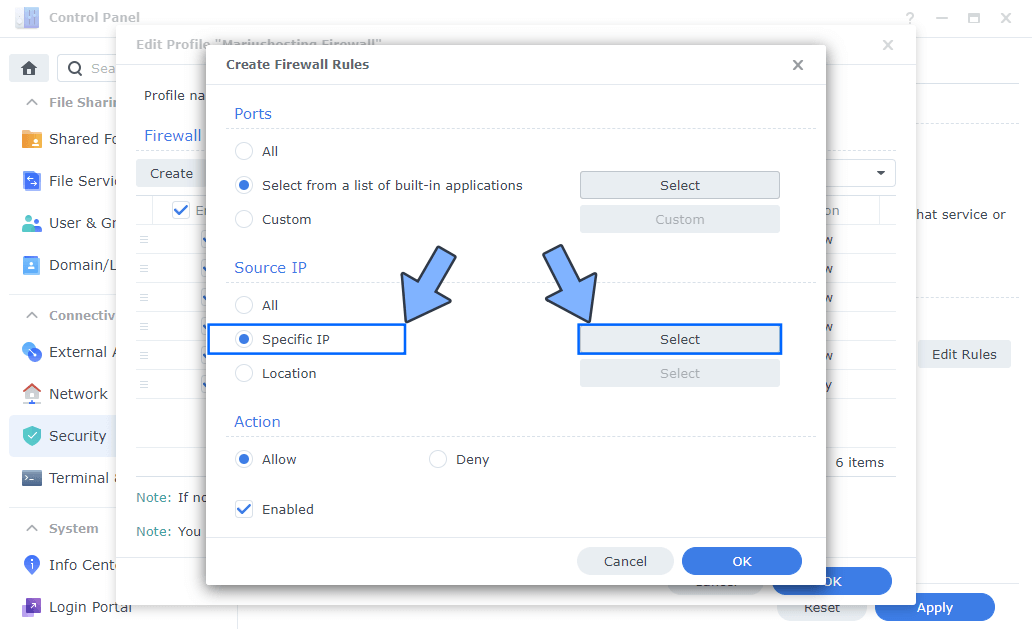
After you click OK at STEP 7, choose “Specific IP” then click Select. Follow the instructions in the image below.
STEP 9
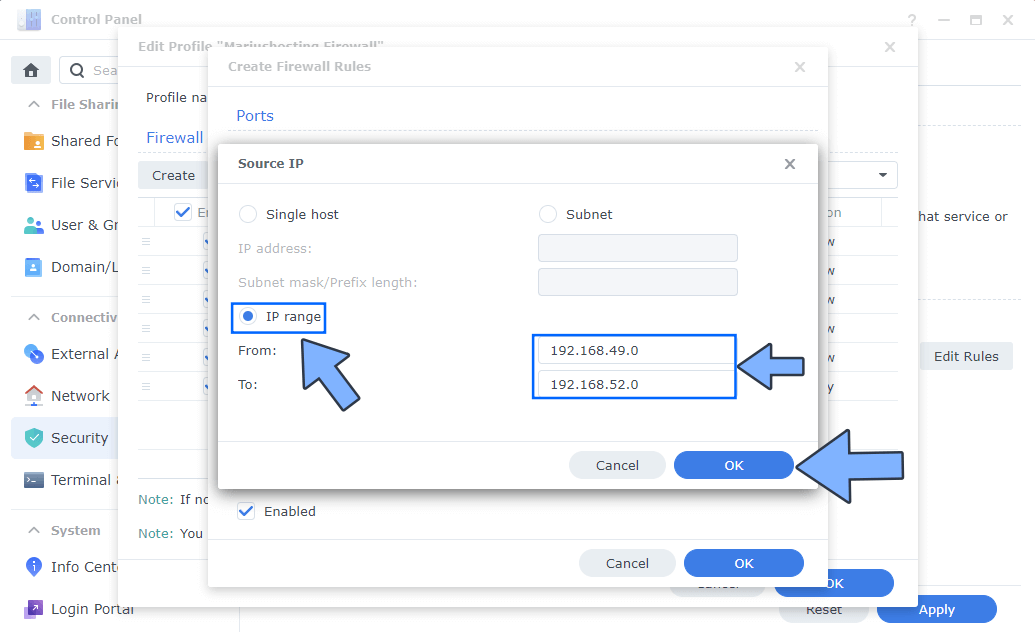
Choose IP range. Add From: 192.168.49.0 To: 192.168.52.0 then click OK. Follow the instructions in the image below.
STEP 10
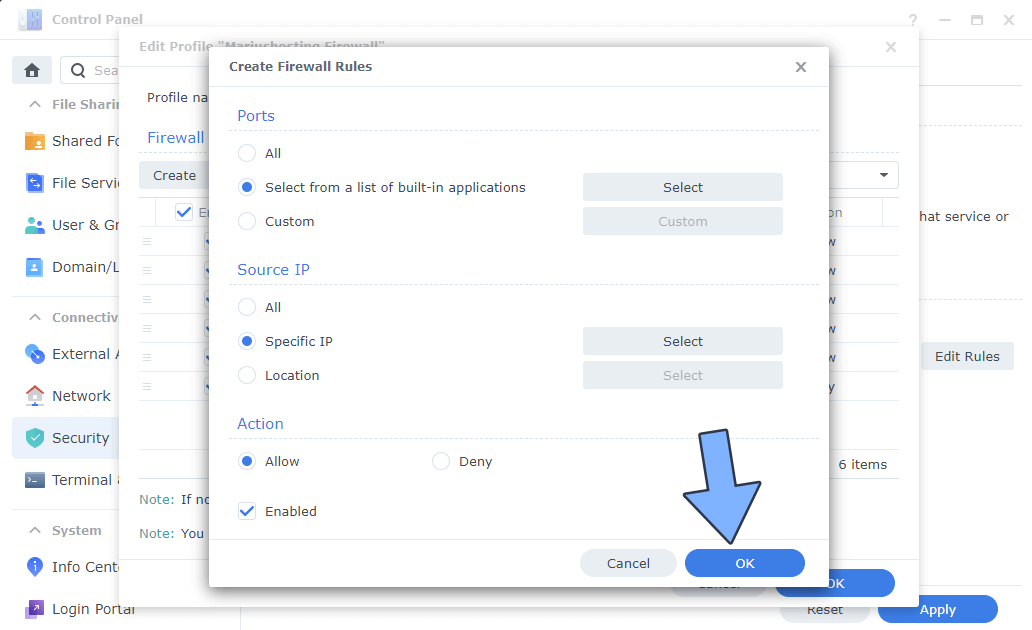
Click OK. Follow the instructions in the image below
STEP 11
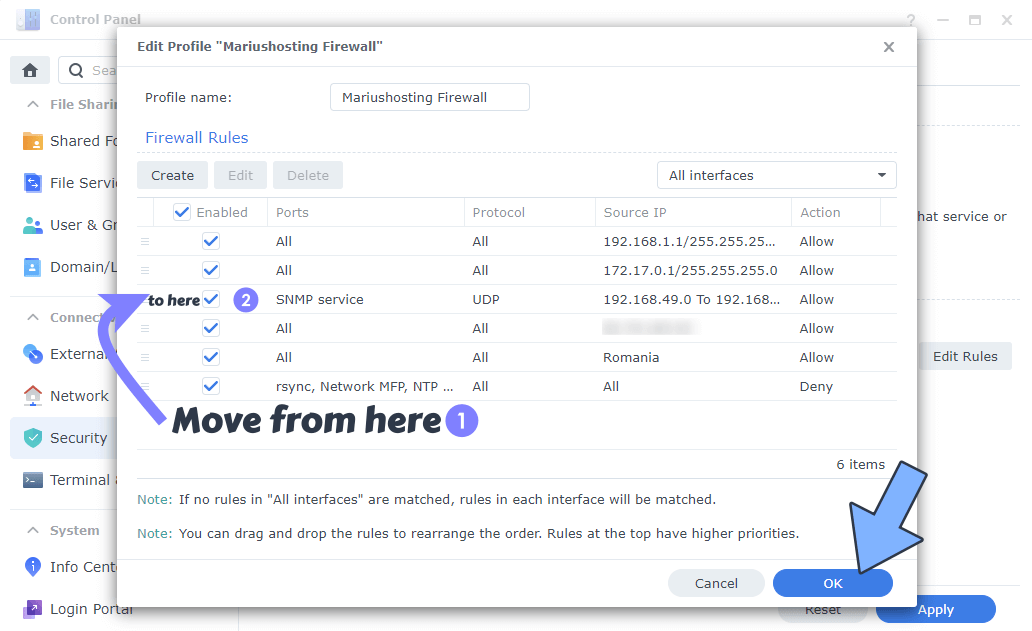
Your new Docker Firewall rule will be ABOVE the Deny rule. Move it from the last position to the third position or any position above the Deny rule. Click OK to save the Firewall Settings. Follow the instructions in the image below.
STEP 12
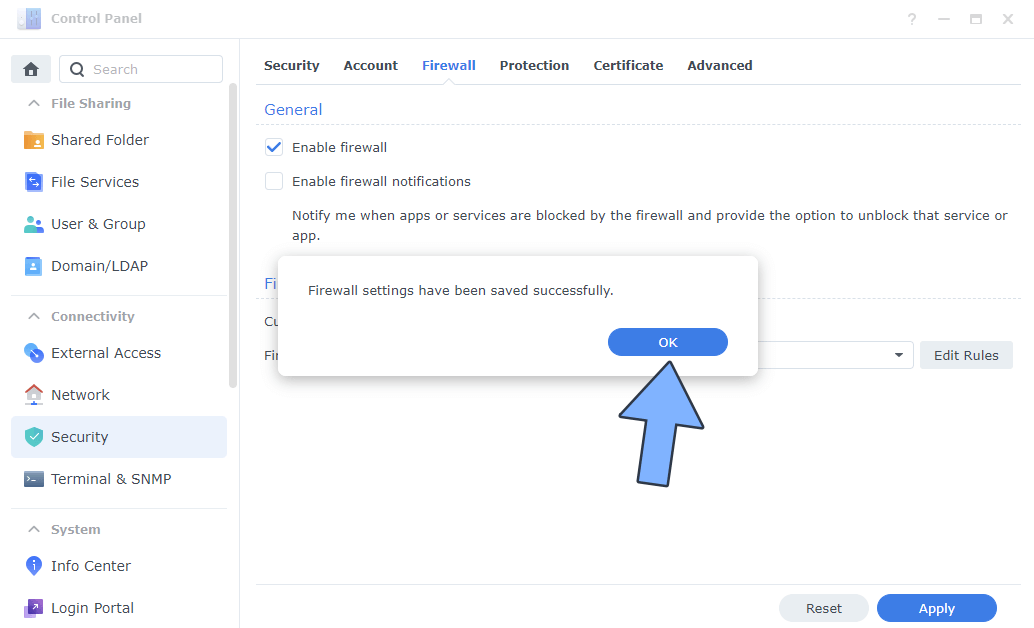
Click OK. Follow the instructions in the image below.
STEP 13
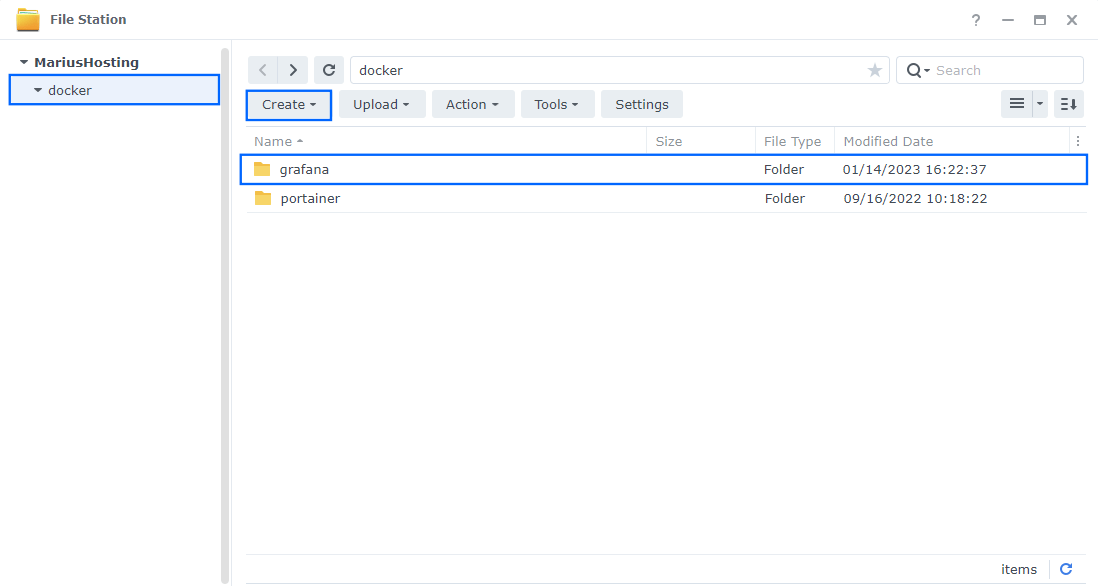
Go to File Station and open the docker folder. Inside the docker folder, create one new folder and name it grafana. Follow the instructions in the image below.
Note: Be careful to enter only lowercase, not uppercase letters.
STEP 14
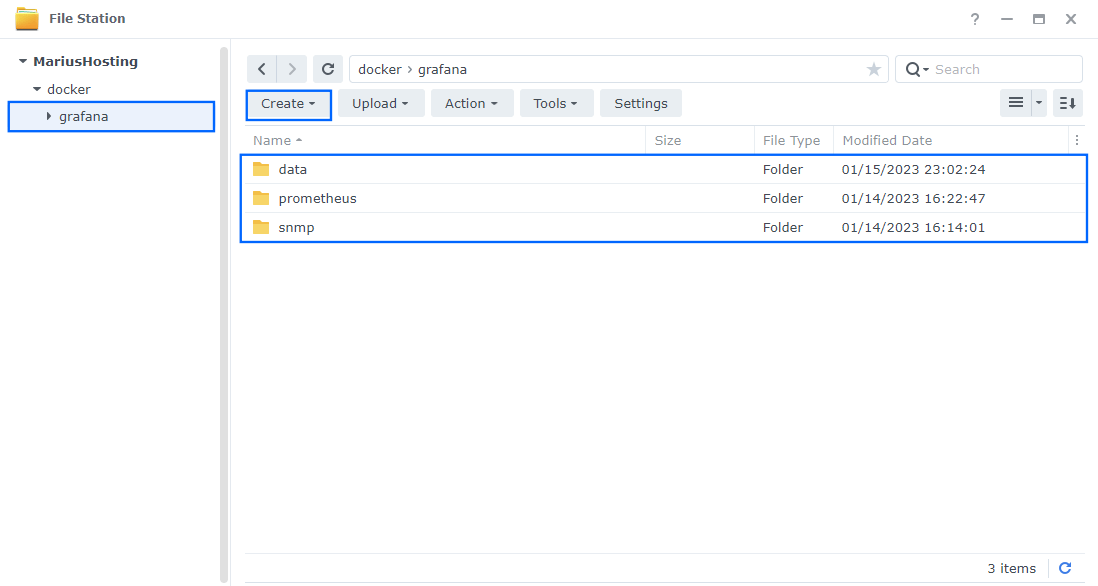
Now create three new folders inside the grafana folder that you created at STEP 13 and name them data, prometheus, snmp. Follow the instructions in the image below.
Note: Be careful to enter only lowercase, not uppercase letters.
STEP 15
Download (click on the blue link below) then upload the prometheus.yml file below in the grafana folder that you have previously created at STEP 13. Follow the instructions in the image below. 🔒Note: Support my work to unlock the password. You can use this password to download any file on mariushosting forever!
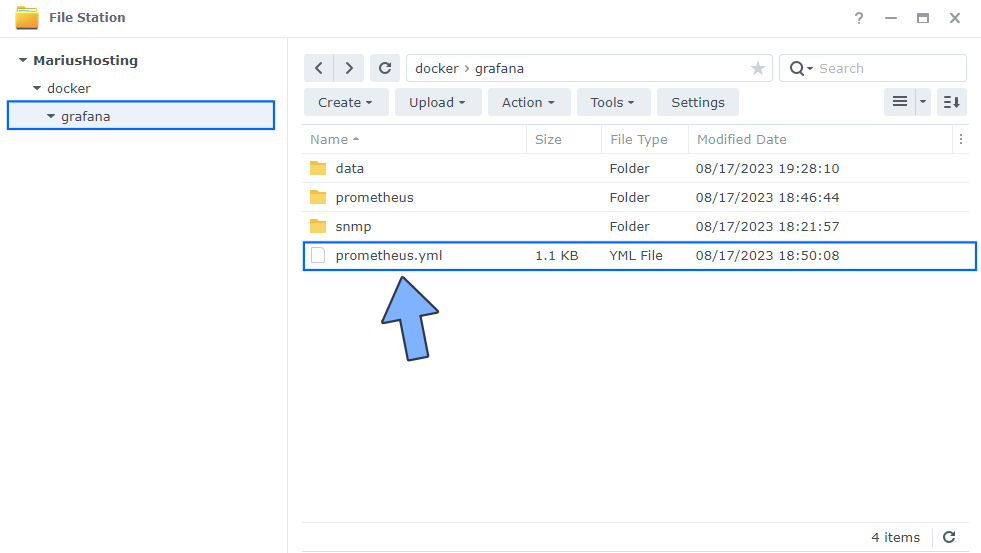
STEP 16
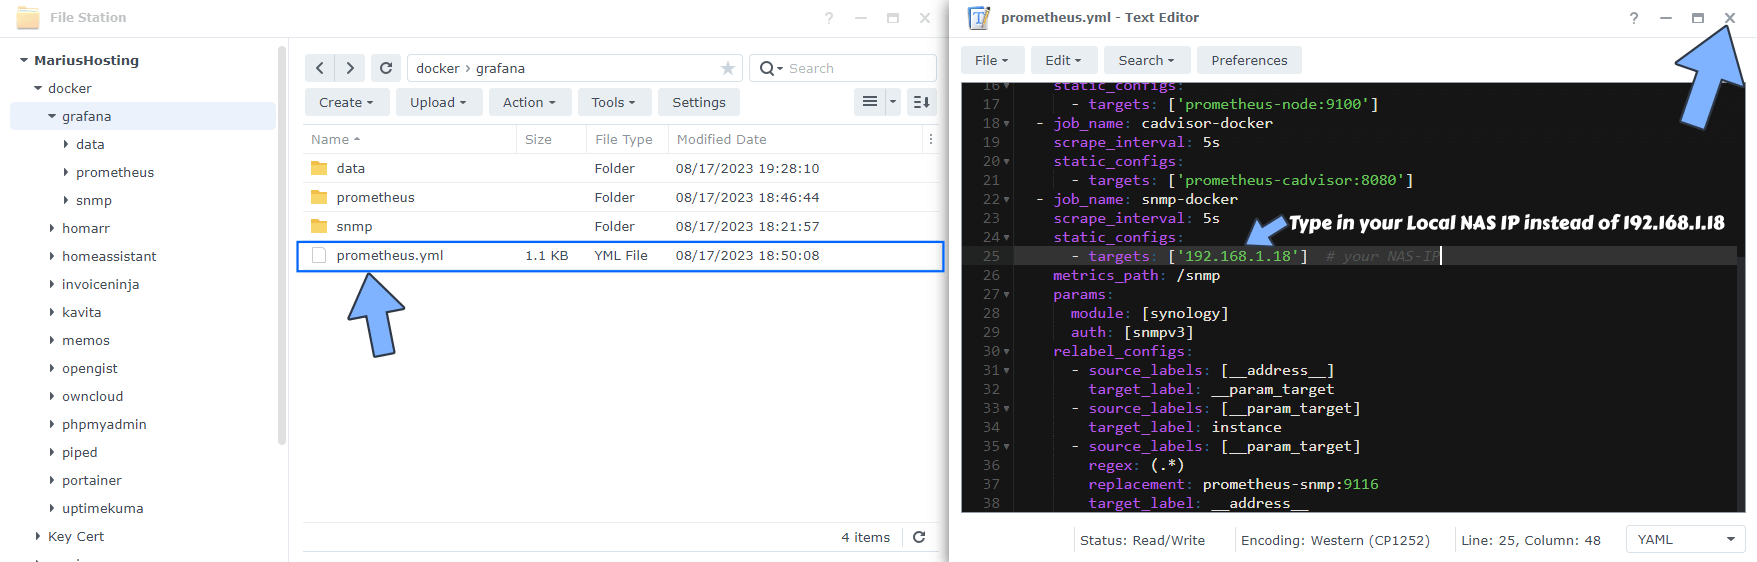
Make sure you have installed Synology Text Editor as per the instructions at STEP 2. Double click on the prometheus.yml file then type in your own local NAS IP instead of 192.168.1.18 which is my own local NAS IP. Click X to save the file. Follow the instructions in the image below.
STEP 17
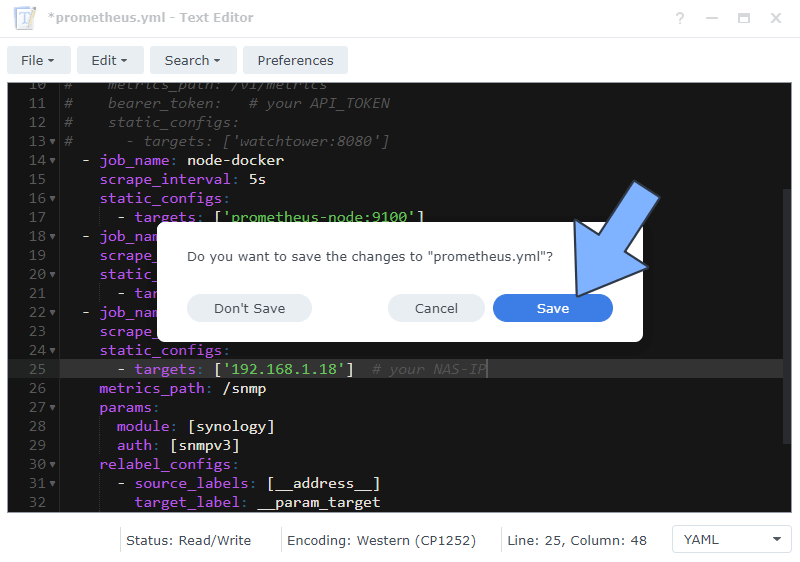
Click Save to save the file. Follow the instructions in the image below.
STEP 18
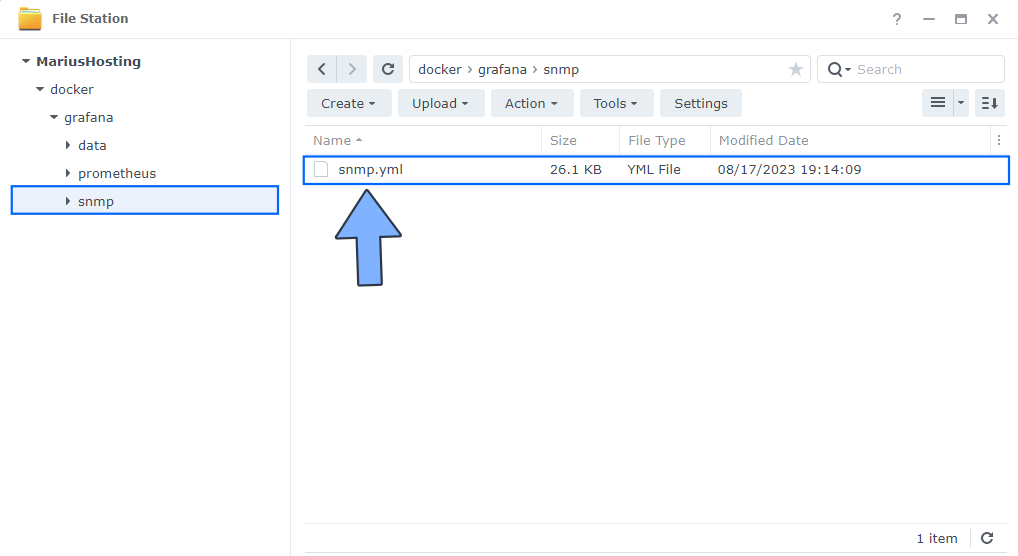
Download (click on the blue link below) then upload the snmp.yml file below in the snmp folder that you have previously created at STEP 14. Follow the instructions in the image below. 🔒Note: Support my work to unlock the password. You can use this password to download any file on mariushosting forever!
STEP 19
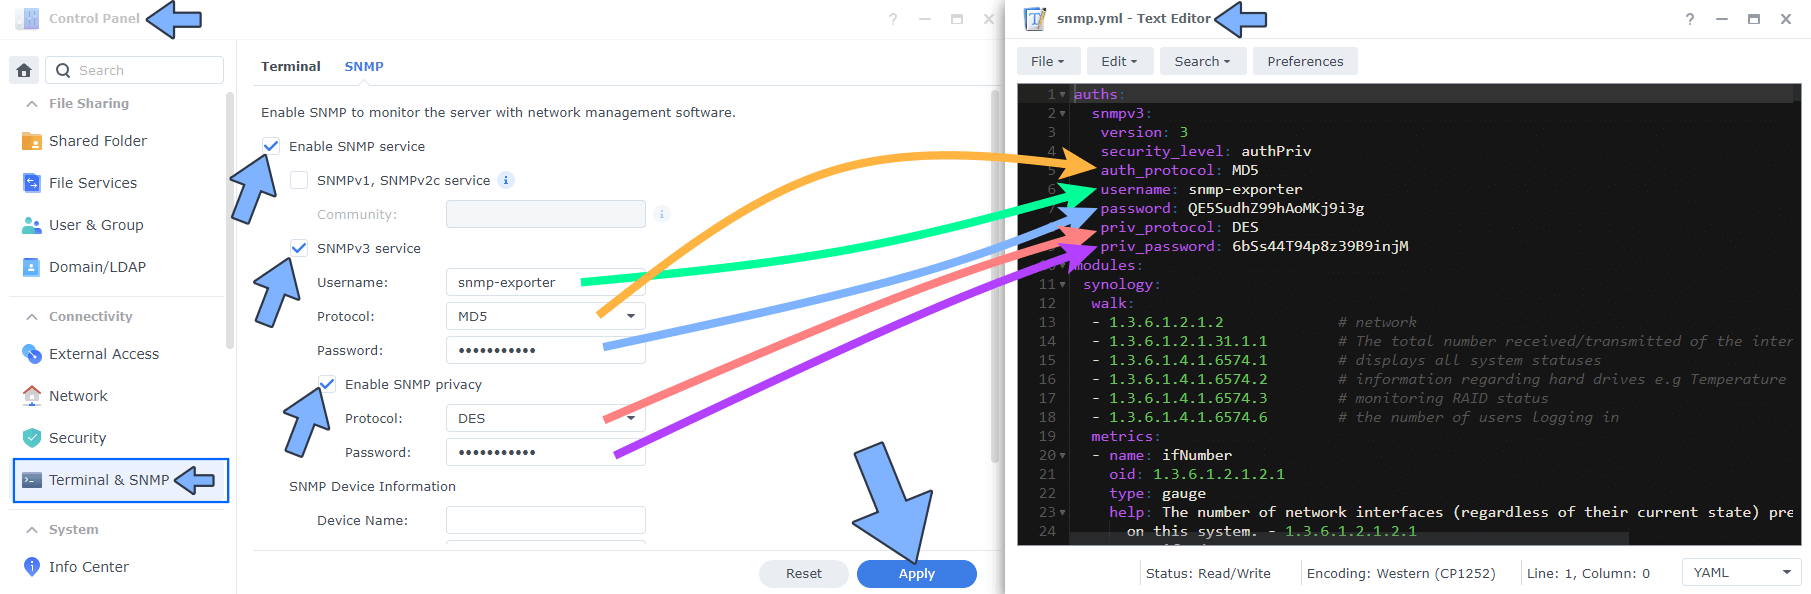
Make sure you have installed Synology Text Editor as per the instructions at STEP 2. Double click on the snmp.yml file that you have previously uploaded at STEP 18.
Go to Control Panel / Terminal & SNMP / SNMP tab / Check Enable SNMP service. Check SNMPv3 service. Check Enable SNMP privacy. Copy paste the username and passwords from the snmp.yml file in the SNMP fields, then click Apply. Follow the instructions in the image below.
STEP 20
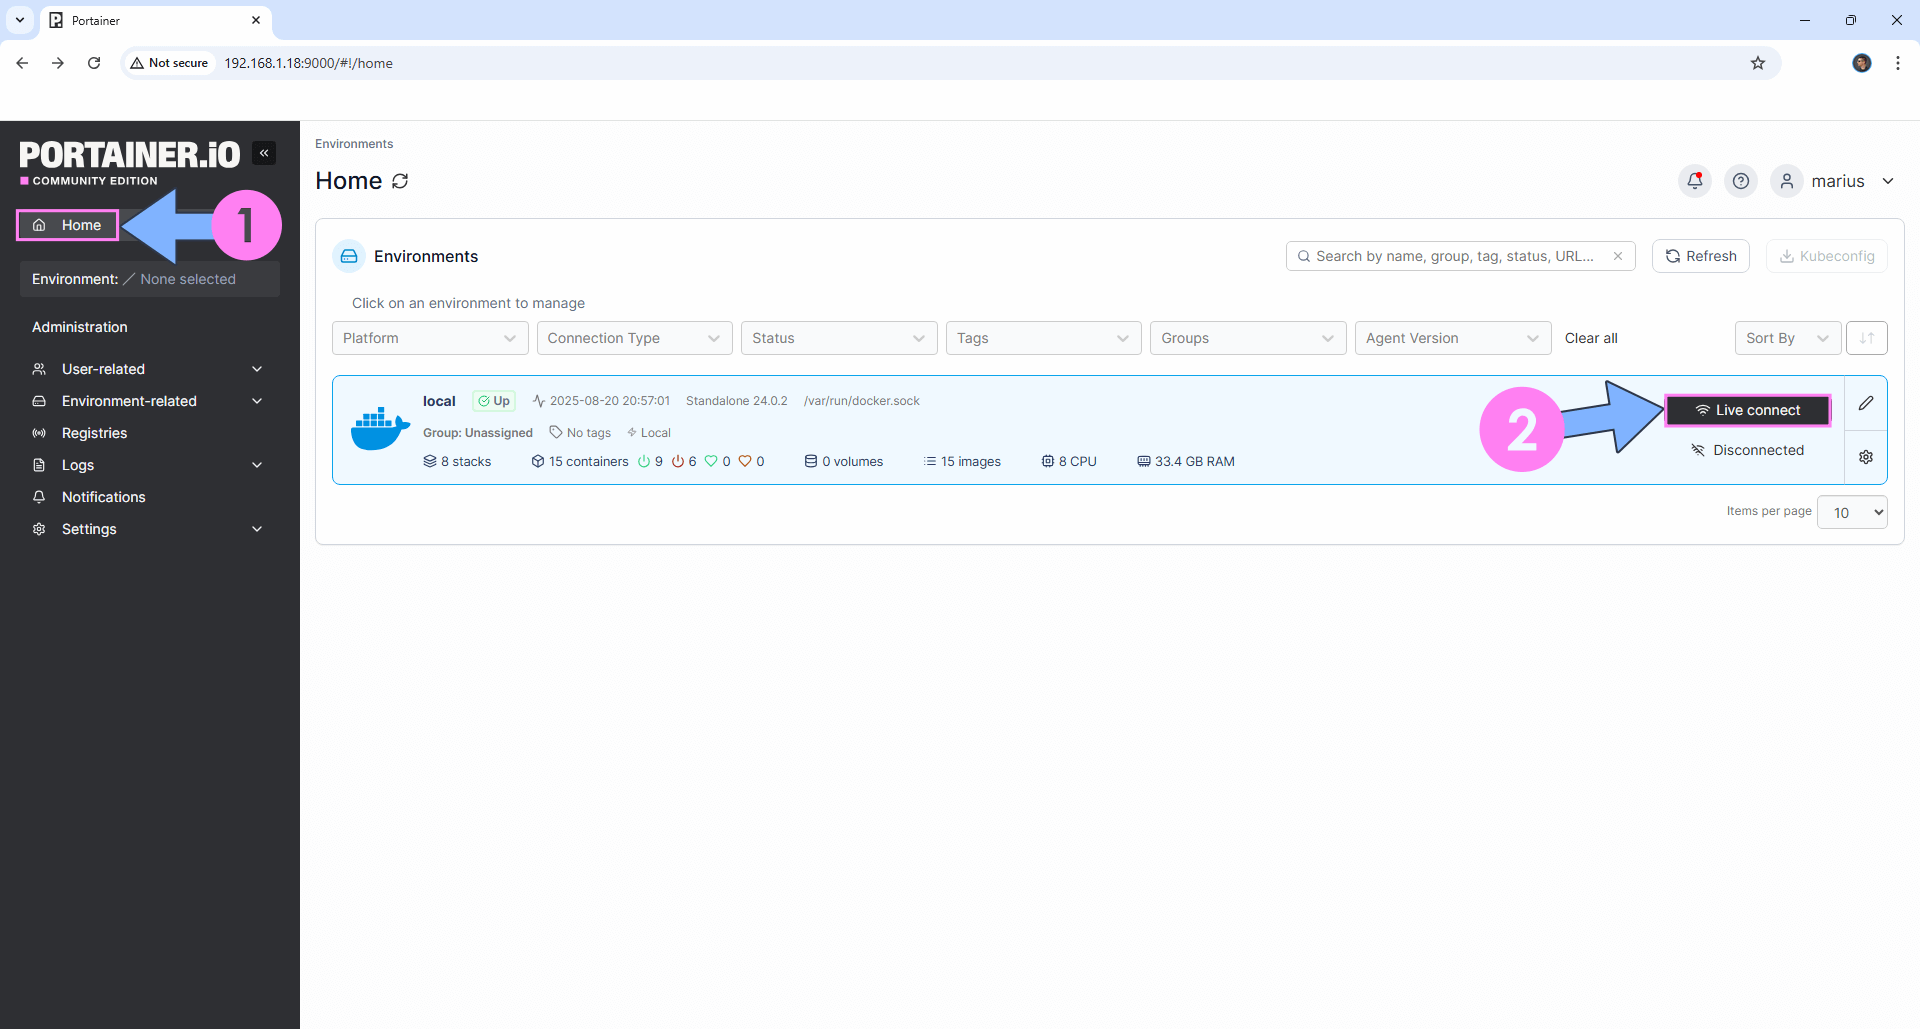
Log into Portainer using your username and password. On the left sidebar in Portainer, click on Home then Live connect. Follow the instructions in the image below.
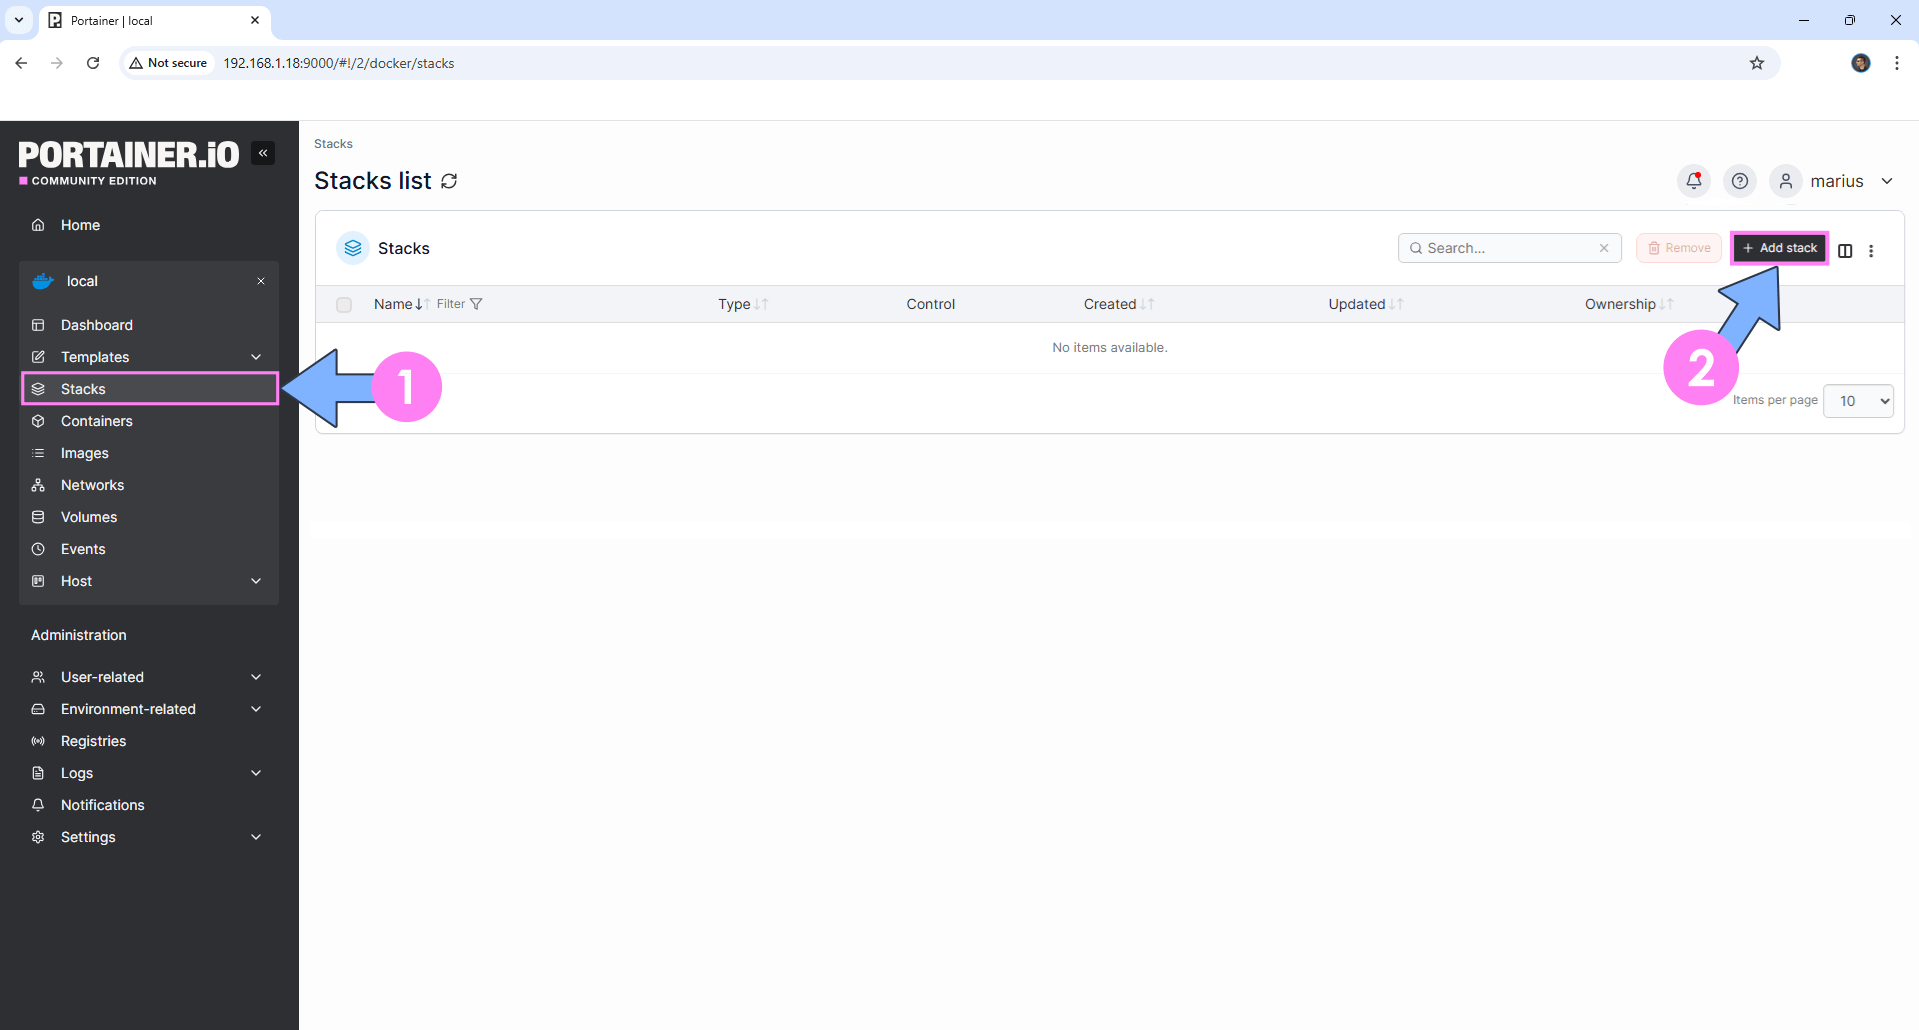
On the left sidebar in Portainer, click on Stacks then + Add stack. Follow the instructions in the image below.
STEP 21
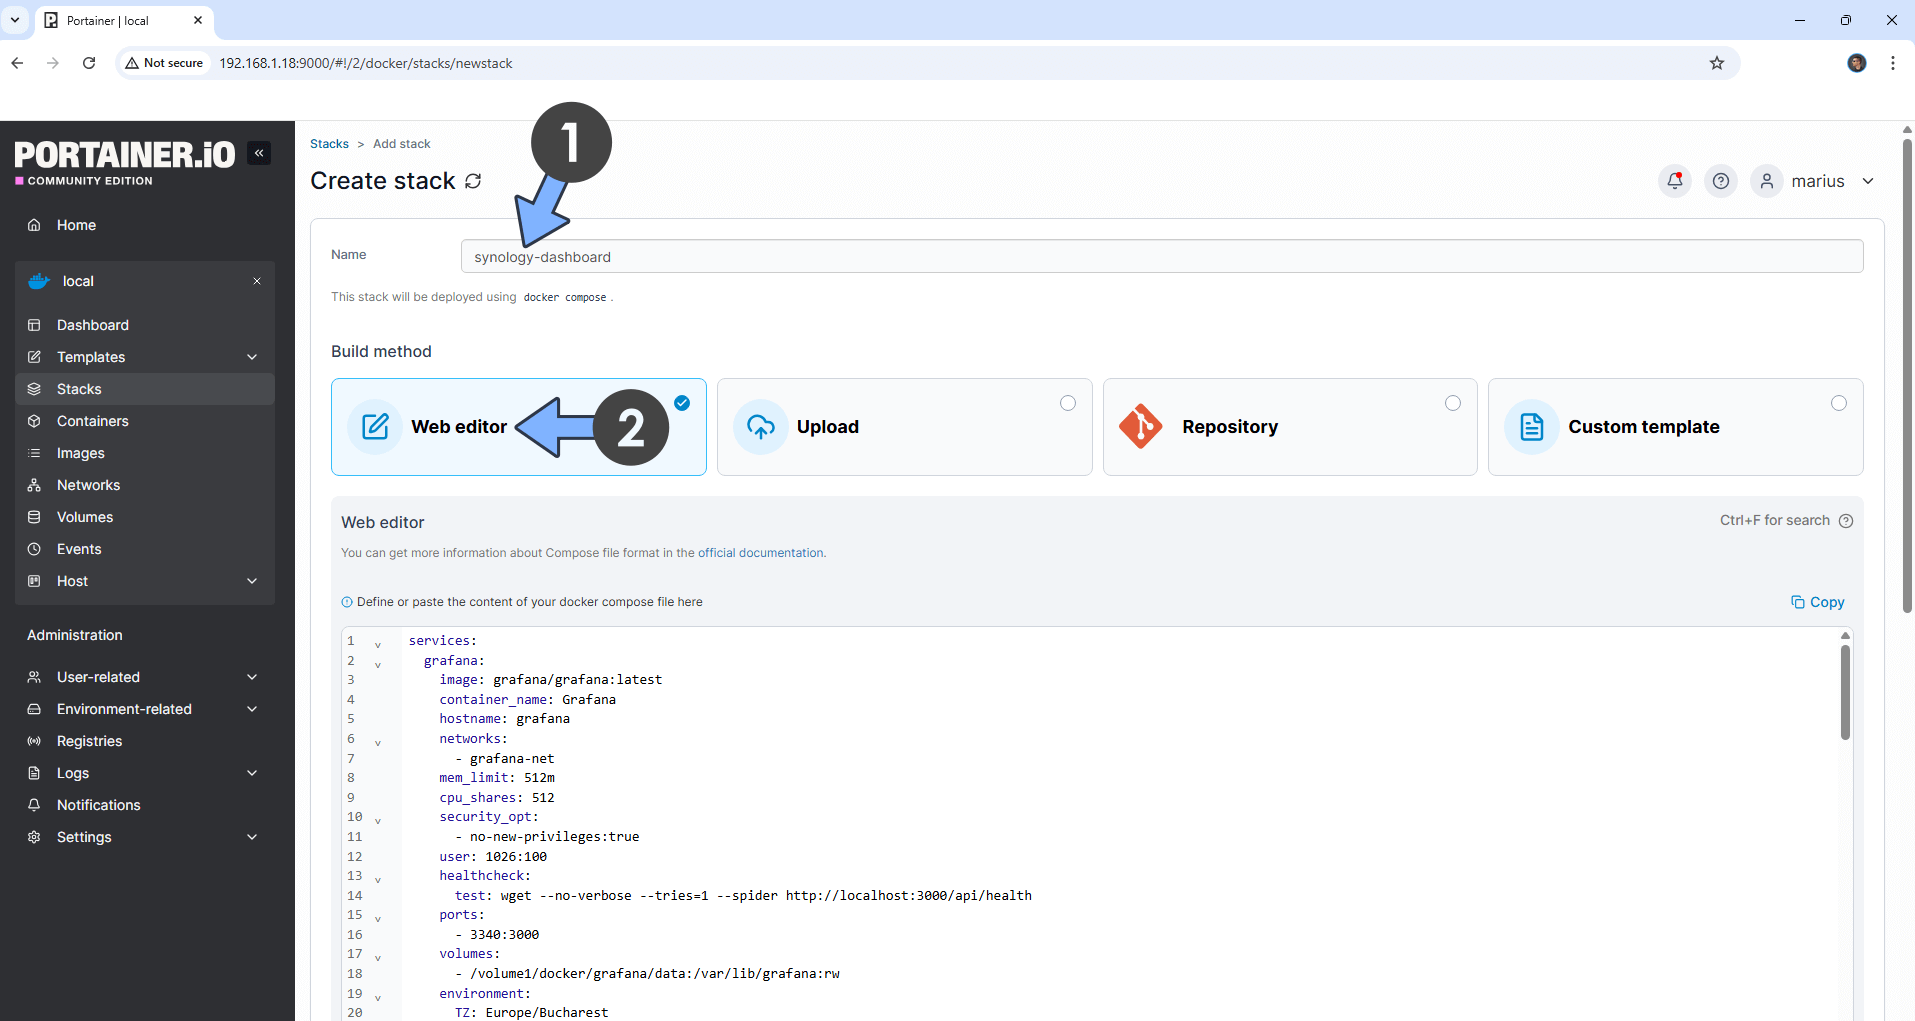
In the Name field type in synology-dashboard. Follow the instructions in the image below.
services:
  grafana:
    image: grafana/grafana:latest
    container_name: Grafana
    hostname: grafana
    networks:
      - grafana-net
    mem_limit: 512m
    cpu_shares: 512
    security_opt:
      - no-new-privileges:true
    user: 1026:100
    healthcheck:
      test: wget --no-verbose --tries=1 --spider http://localhost:3000/api/health
    ports:
      - 3340:3000
    volumes:
      - /volume1/docker/grafana/data:/var/lib/grafana:rw
    environment:
      TZ: Europe/Bucharest
      GF_INSTALL_PLUGINS: grafana-clock-panel,grafana-simple-json-datasource,natel-discrete-panel,grafana-piechart-panel
    restart: on-failure:5

  prometheus:
    image: prom/prometheus
    command:
      - '--storage.tsdb.retention.time=60d'
      - '--config.file=/etc/prometheus/prometheus.yml'
    container_name: Prometheus
    hostname: prometheus-server
    networks:
      - grafana-net
      - prometheus-net
    mem_limit: 1g
    cpu_shares: 768
    security_opt:
      - no-new-privileges=true
    user: 1026:100
    healthcheck:
      test: wget --no-verbose --tries=1 --spider http://localhost:9090/ || exit 1
    volumes:
      - /volume1/docker/grafana/prometheus:/prometheus:rw
      - /volume1/docker/grafana/prometheus.yml:/etc/prometheus/prometheus.yml:ro
    restart: on-failure:5

  node-exporter:
    image: prom/node-exporter:latest
    command:
      - --collector.disable-defaults
      - --collector.stat
      - --collector.time
      - --collector.cpu
      - --collector.loadavg
      - --collector.hwmon
      - --collector.meminfo
      - --collector.diskstats
    container_name: Prometheus-Node
    hostname: prometheus-node
    networks:
      - prometheus-net
    mem_limit: 256m
    mem_reservation: 64m
    cpu_shares: 512
    security_opt:
      - no-new-privileges=true
    read_only: true
    user: 1026:100
    healthcheck:
      test: wget --no-verbose --tries=1 --spider http://localhost:9100/
    restart: on-failure:5

  snmp-exporter:
    image: prom/snmp-exporter:latest
    command:
      - '--config.file=/etc/snmp_exporter/snmp.yml'
    container_name: Prometheus-SNMP
    hostname: prometheus-snmp
    networks:
      - prometheus-net
    mem_limit: 256m
    mem_reservation: 64m
    cpu_shares: 512
    security_opt:
      - no-new-privileges:true
    read_only: true
    user: 1026:100
    healthcheck:
      test: wget --no-verbose --tries=1 --spider http://localhost:9116/ || exit 1
    volumes:
      - /volume1/docker/grafana/snmp:/etc/snmp_exporter/:ro
    restart: on-failure:5

  cadvisor:
    image: gcr.io/cadvisor/cadvisor:v0.52.1
    command:
      - '--docker_only=true'
    container_name: Prometheus-cAdvisor
    hostname: prometheus-cadvisor
    networks:
      - prometheus-net
    mem_limit: 256m
    mem_reservation: 64m
    cpu_shares: 512
    security_opt:
      - no-new-privileges=true
    read_only: true
    volumes:
      - /:/rootfs:ro
      - /var/run:/var/run:ro
      - /sys:/sys:ro
      - /var/run/docker.sock:/var/run/docker.sock:ro
    restart: on-failure:5

networks:
  grafana-net:
    name: grafana-net
    ipam:
      config:
        - subnet: 192.168.50.0/24
  prometheus-net:
    name: prometheus-net
    ipam:
      config:
        - subnet: 192.168.51.0/24
Note: Before you paste the code above in the Web editor area below, change the value numbers for user with your own UID and GID values. (Follow my step by step guide on how to do this.) 1026 is my personal UID value and 100 is my personal GID value. You have to type in your own values.
Note: Before you paste the code above in the Web editor area below, change the value for TZ. (Select your current Time Zone from this list.)
STEP 22
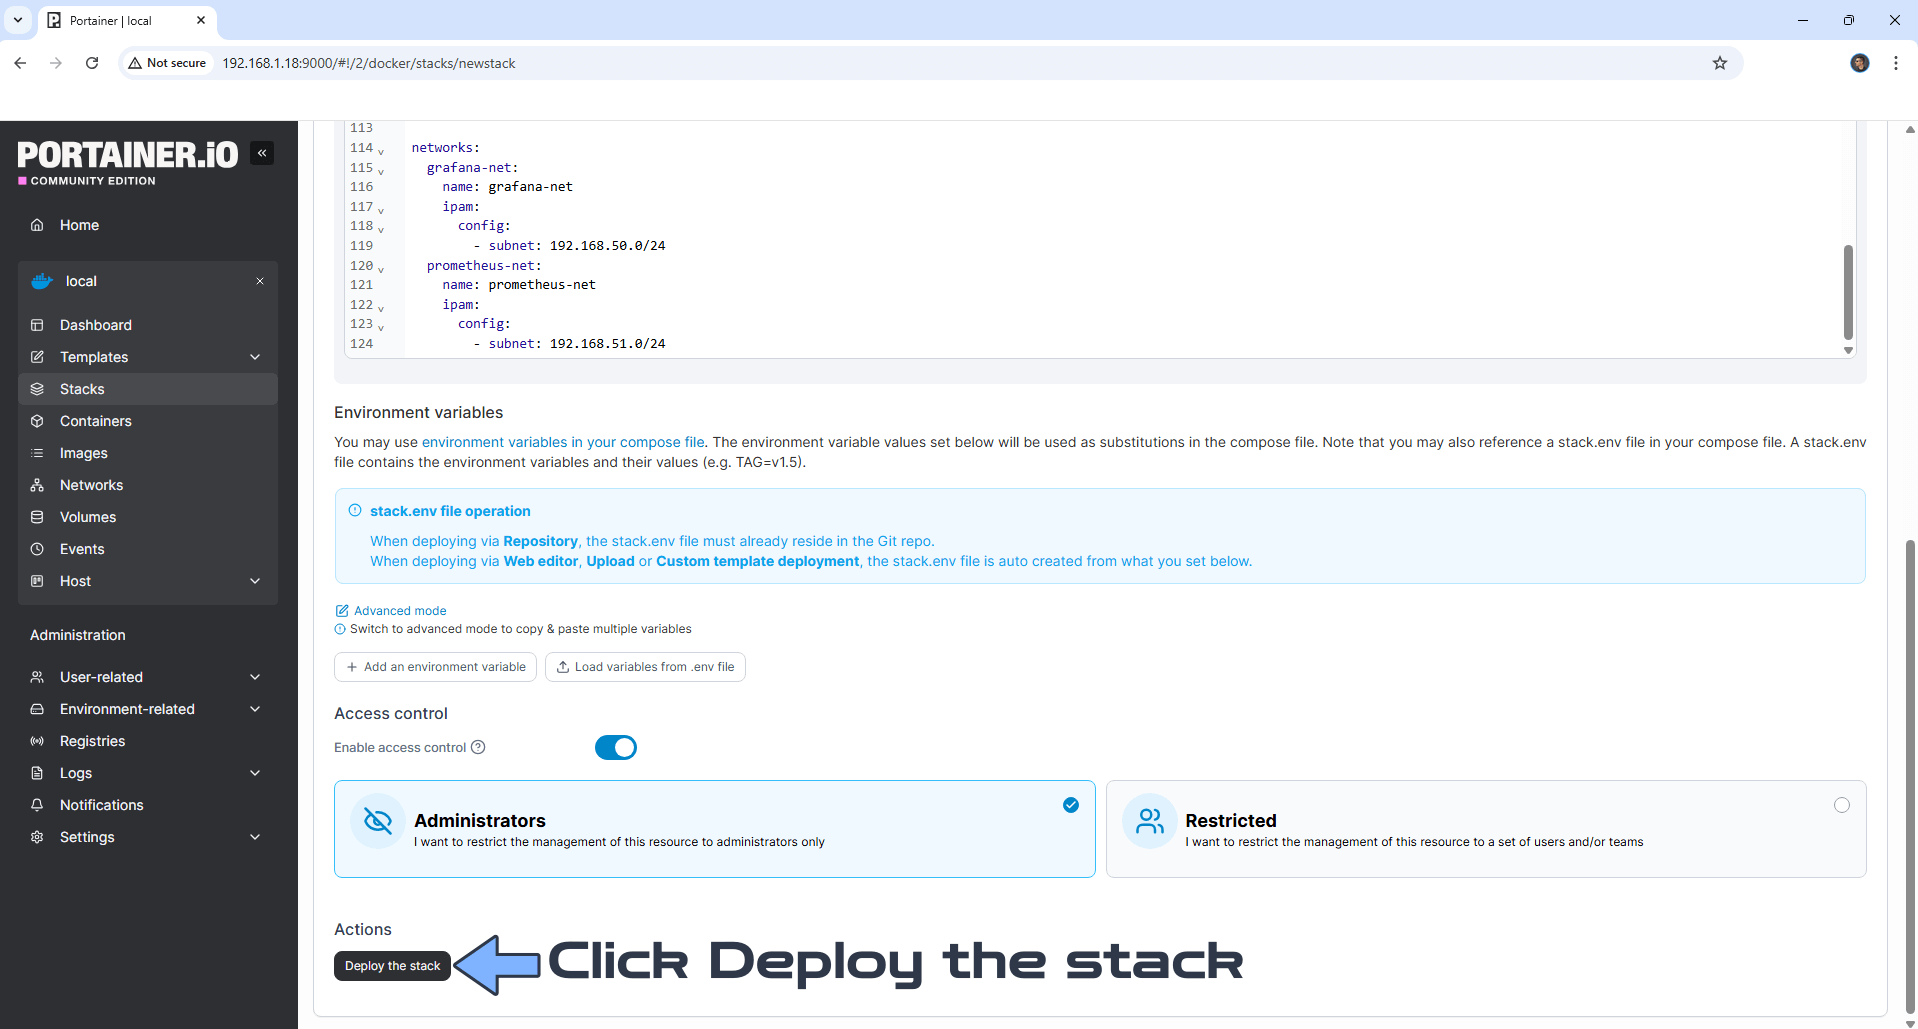
Scroll down on the page until you see a button named Deploy the stack. Click on it. Follow the instructions in the image below. The installation process can take up to a few minutes. It will depend on your Internet speed connection.
STEP 23
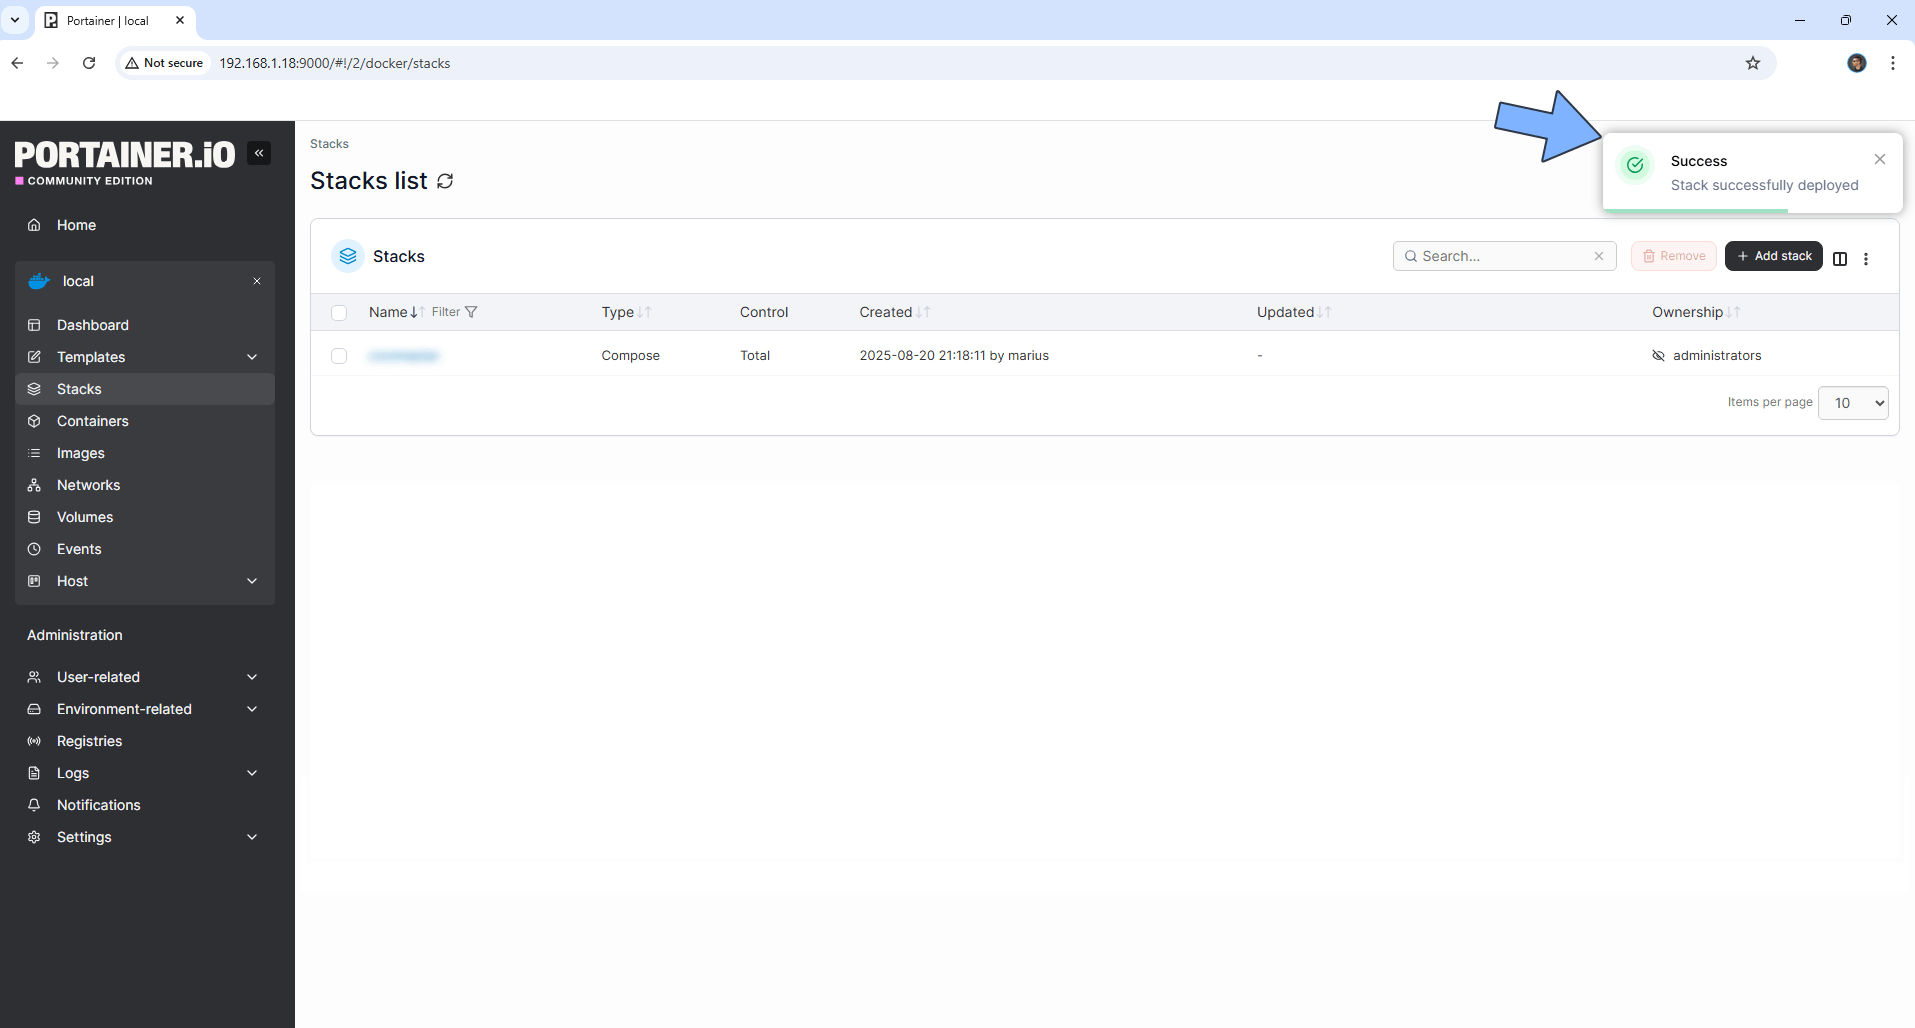
If everything goes right, you will see the following message at the top right of your screen: “Success Stack successfully deployed“.
STEP 24
🟢Please Support My work by Making a Donation. Almost 99,9% of the people that install something using my guides forget to support my work, or just ignore STEP 1. I’ve been very honest about this aspect of my work since the beginning: I don’t run any ADS, I don’t require subscriptions, paid or otherwise, I don’t collect IPs, emails, and I don’t have any referral links from Amazon or other merchants. I also don’t have any POP-UPs or COOKIES. I have repeatedly been told over the years how much I have contributed to the community. It’s something I love doing and have been honest about my passion since the beginning. But I also Need The Community to Support me Back to be able to continue doing this work.
STEP 25
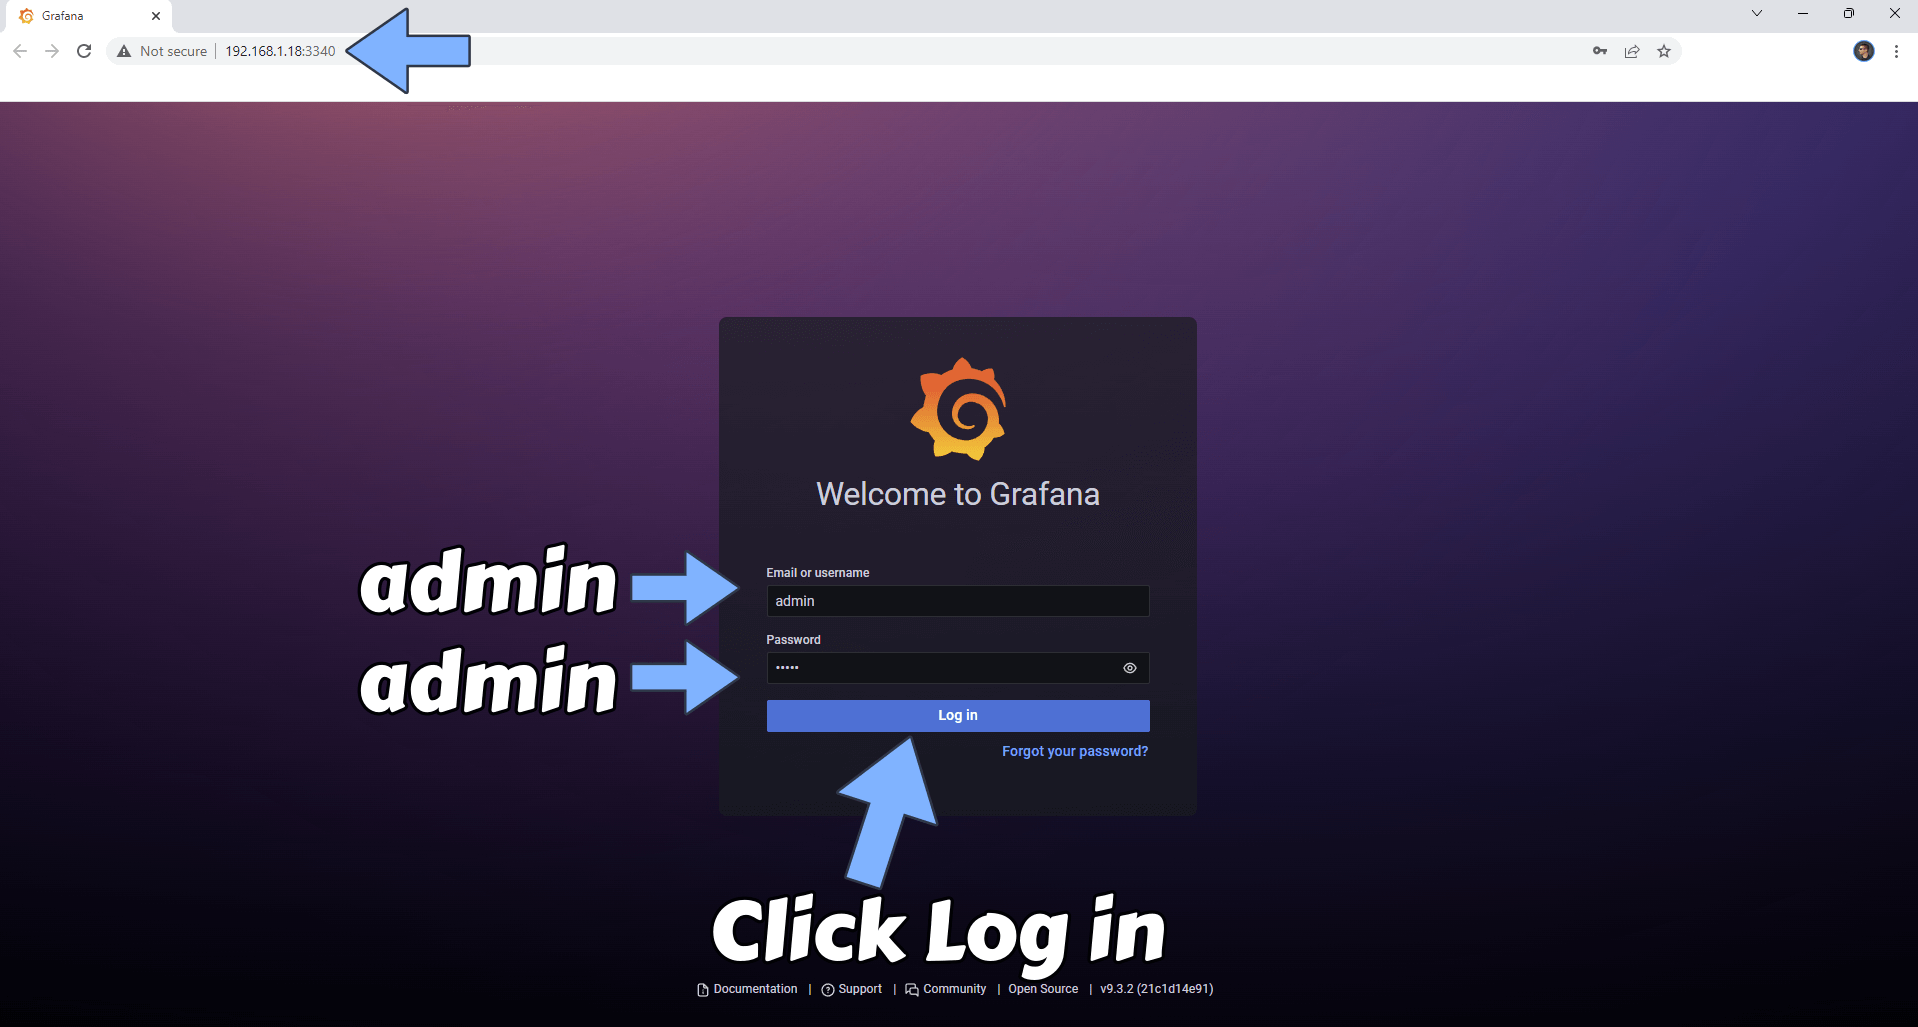
The installation process can take up to a few seconds/minutes. It will depend on your Internet speed connection. Now open your browser and type in http://Synology-ip-address:3340 Type in the default username and password, then click Log in.
STEP 26
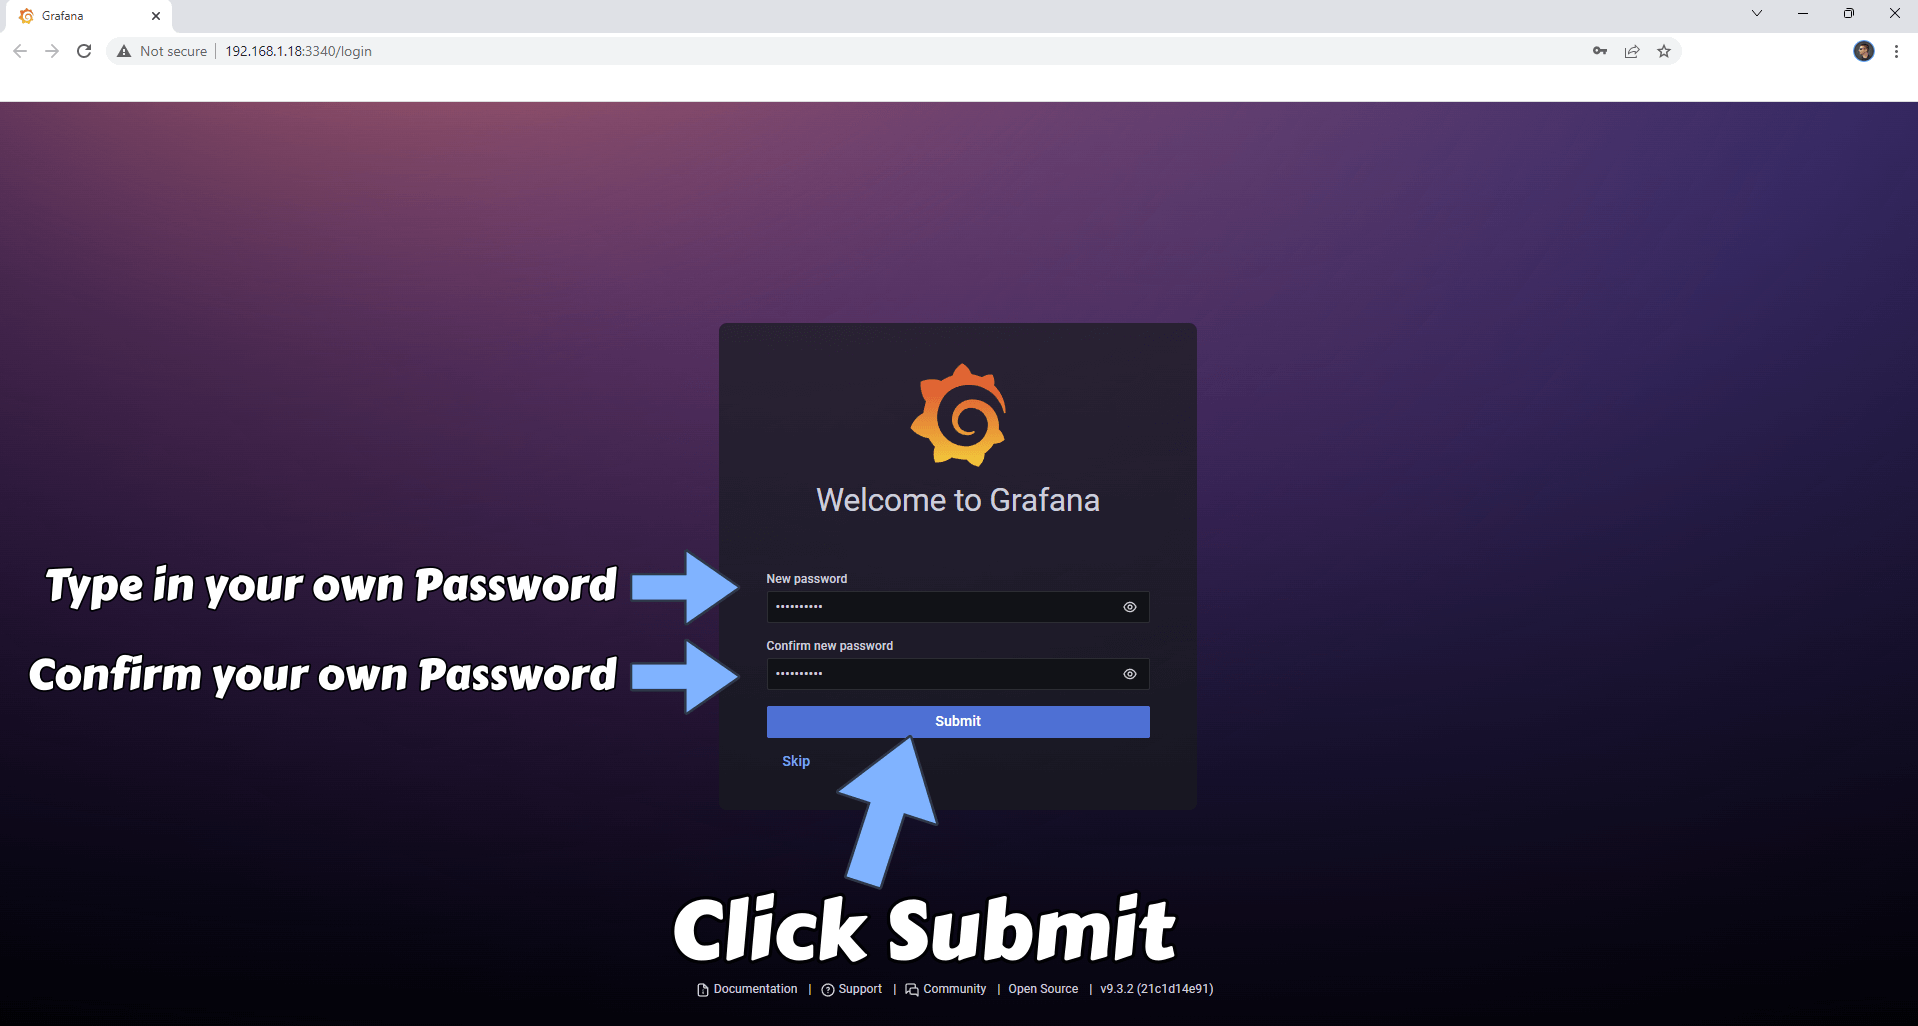
After you click Log in on STEP 25, you will be prompted to change the password. Choose your favorite password, then click Submit. Follow the instructions in the image below.
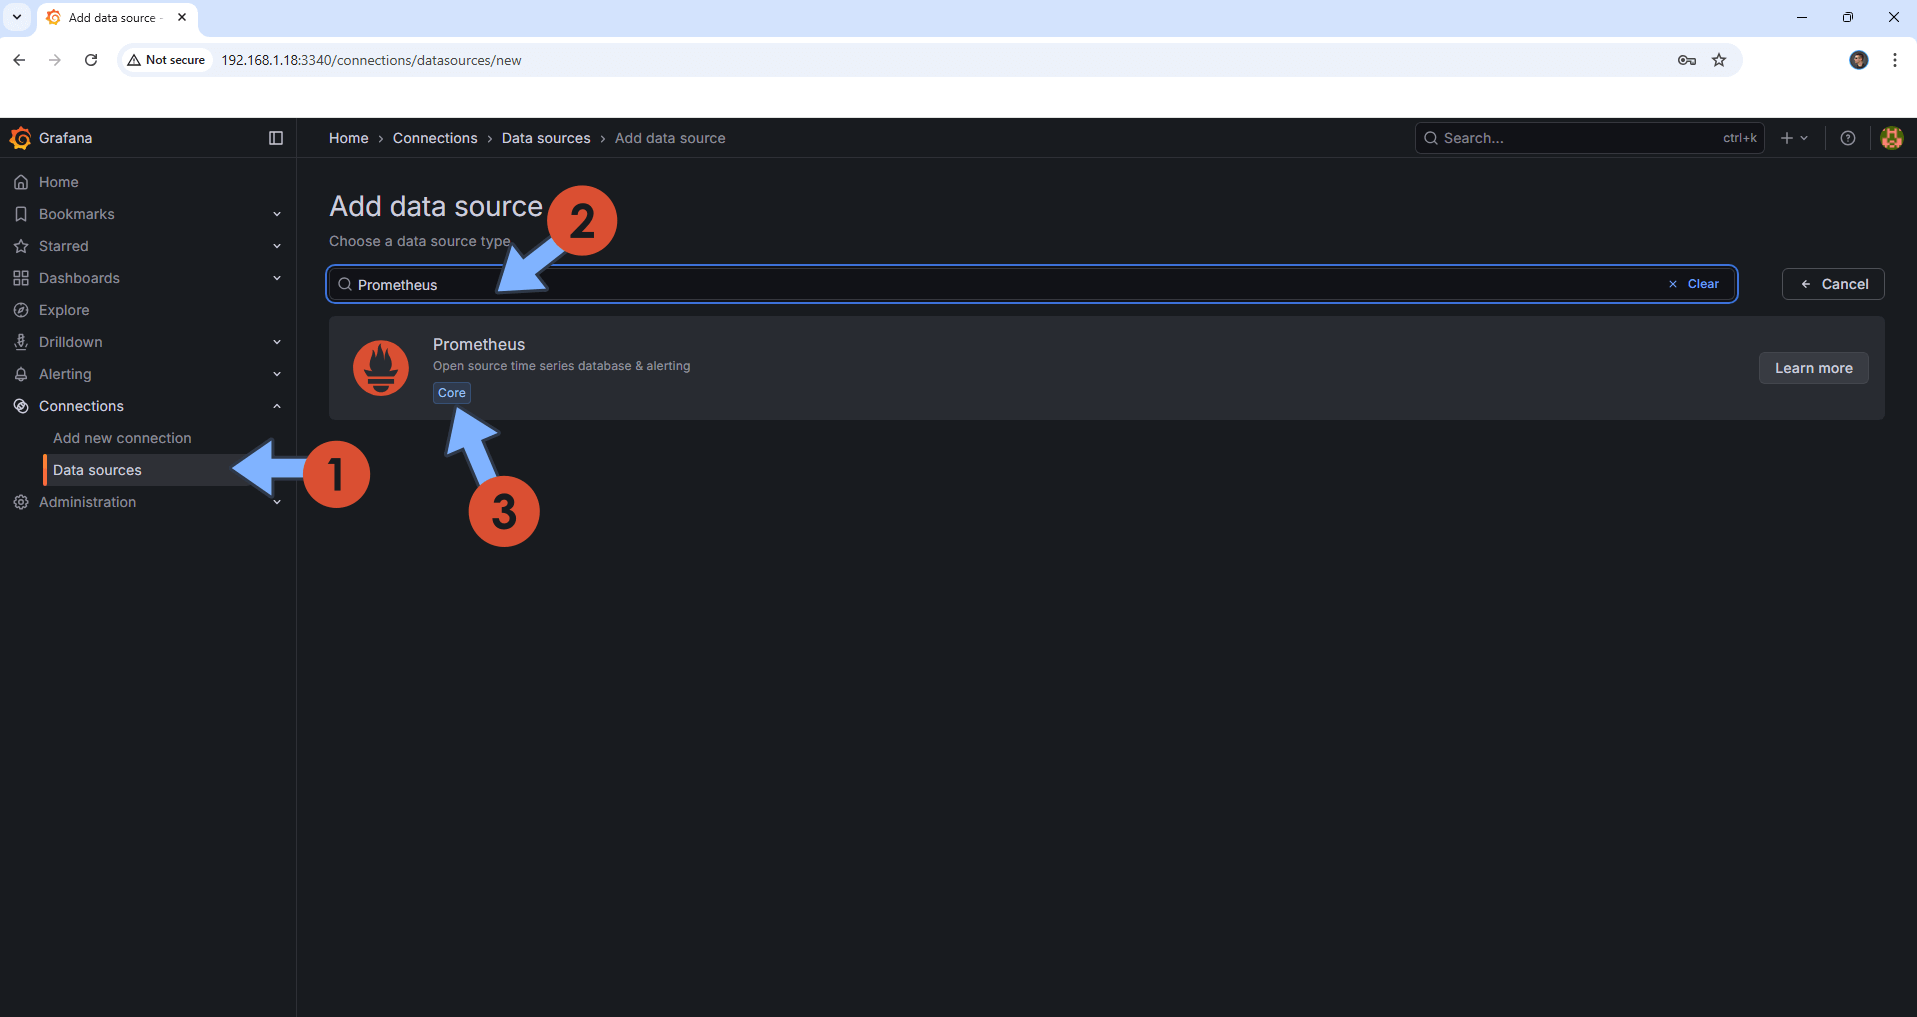
STEP 27
Under Connections click Data sources. Search for Prometheus. When you find it, click Prometheus. Follow the instructions in the image below.
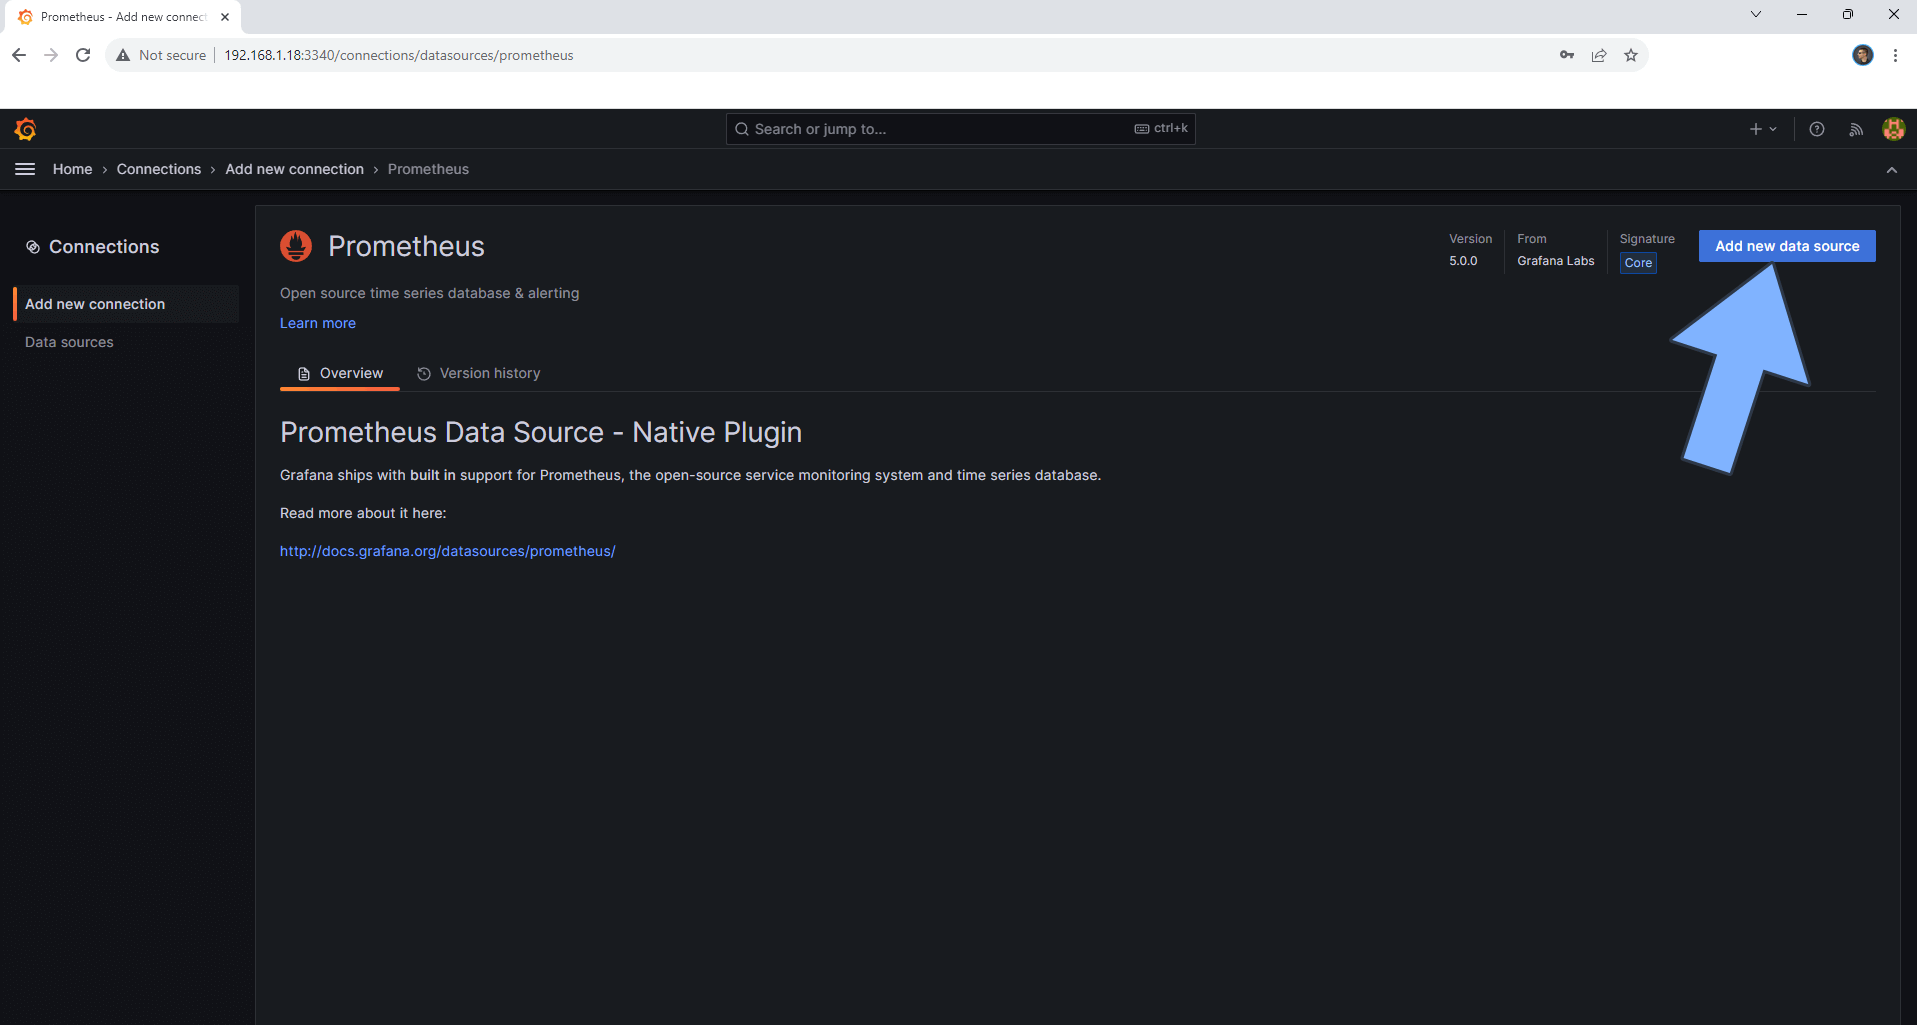
STEP 28
At the top right of the page, click Add new data source. Follow the instructions in the image below.
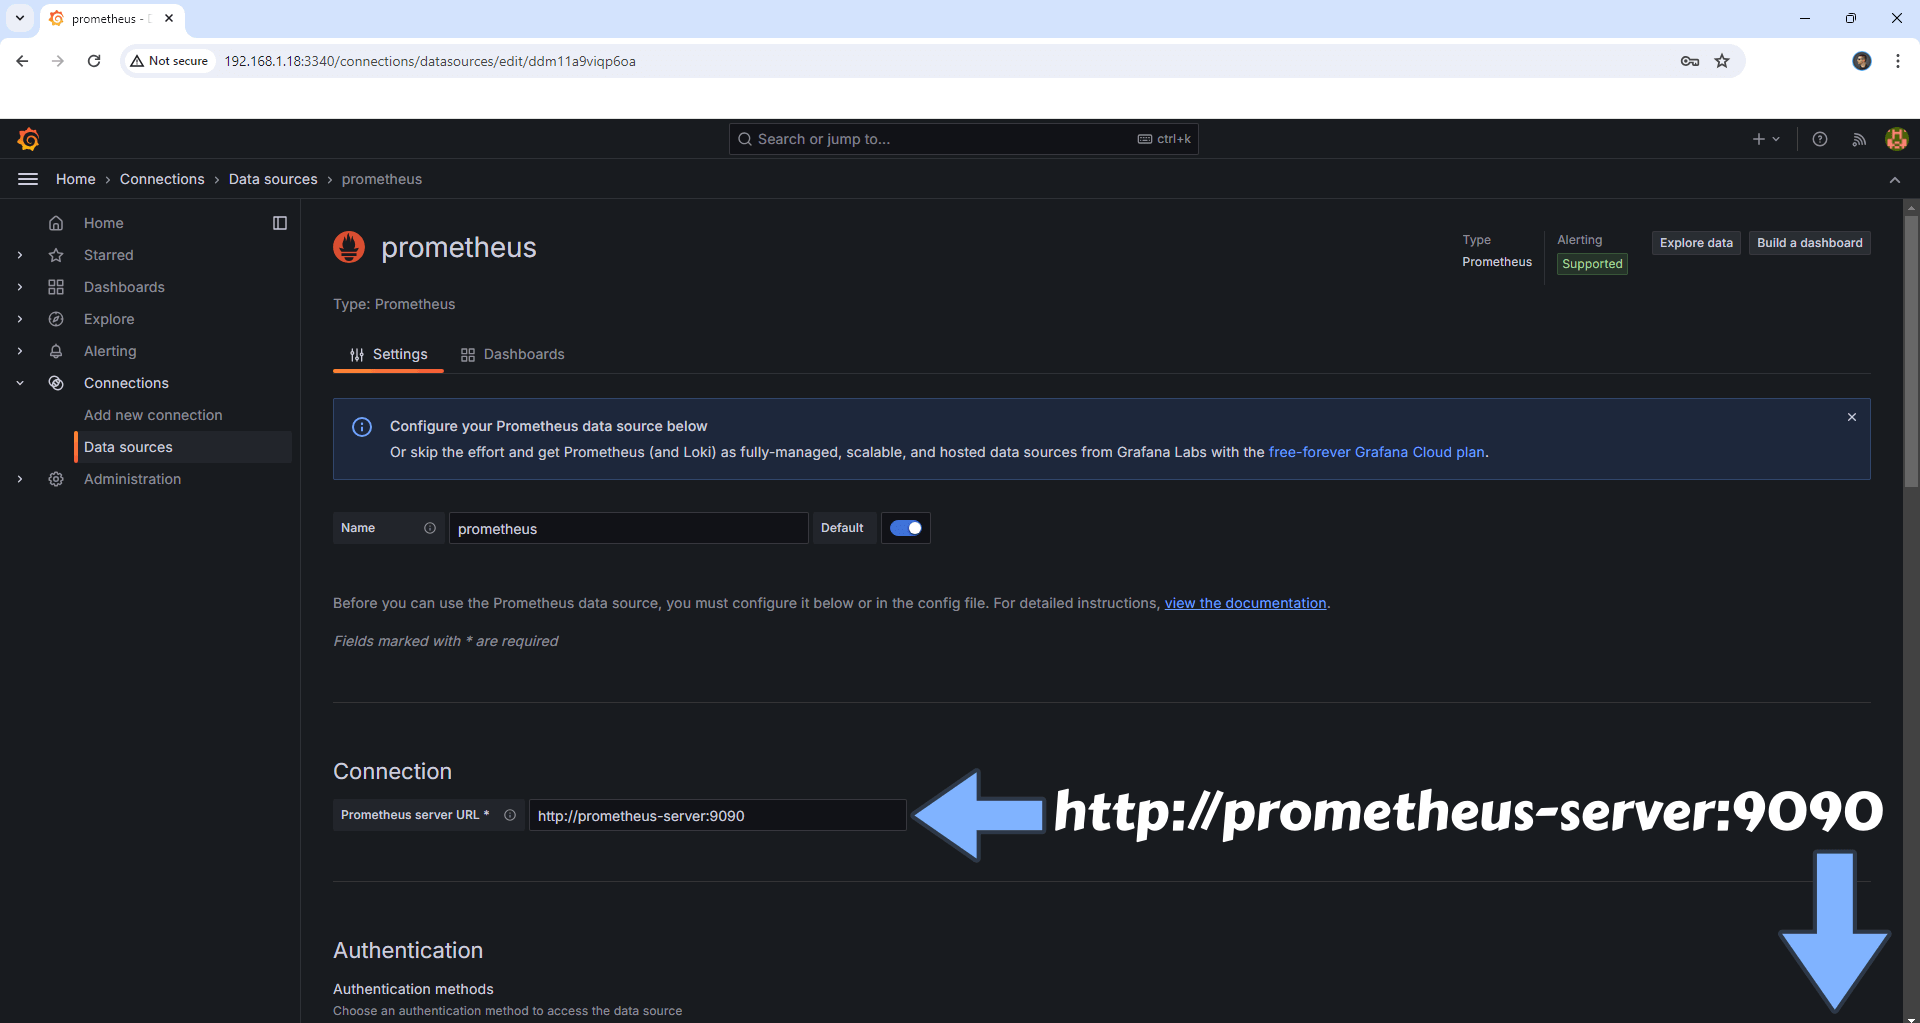
STEP 29
On the URL area type in http://prometheus-server:9090 instead of http://localhost:9090 then scroll down the page a little bit. Also, you can change the name prometheus and use your NAS name instead. Follow the instructions in the image below.
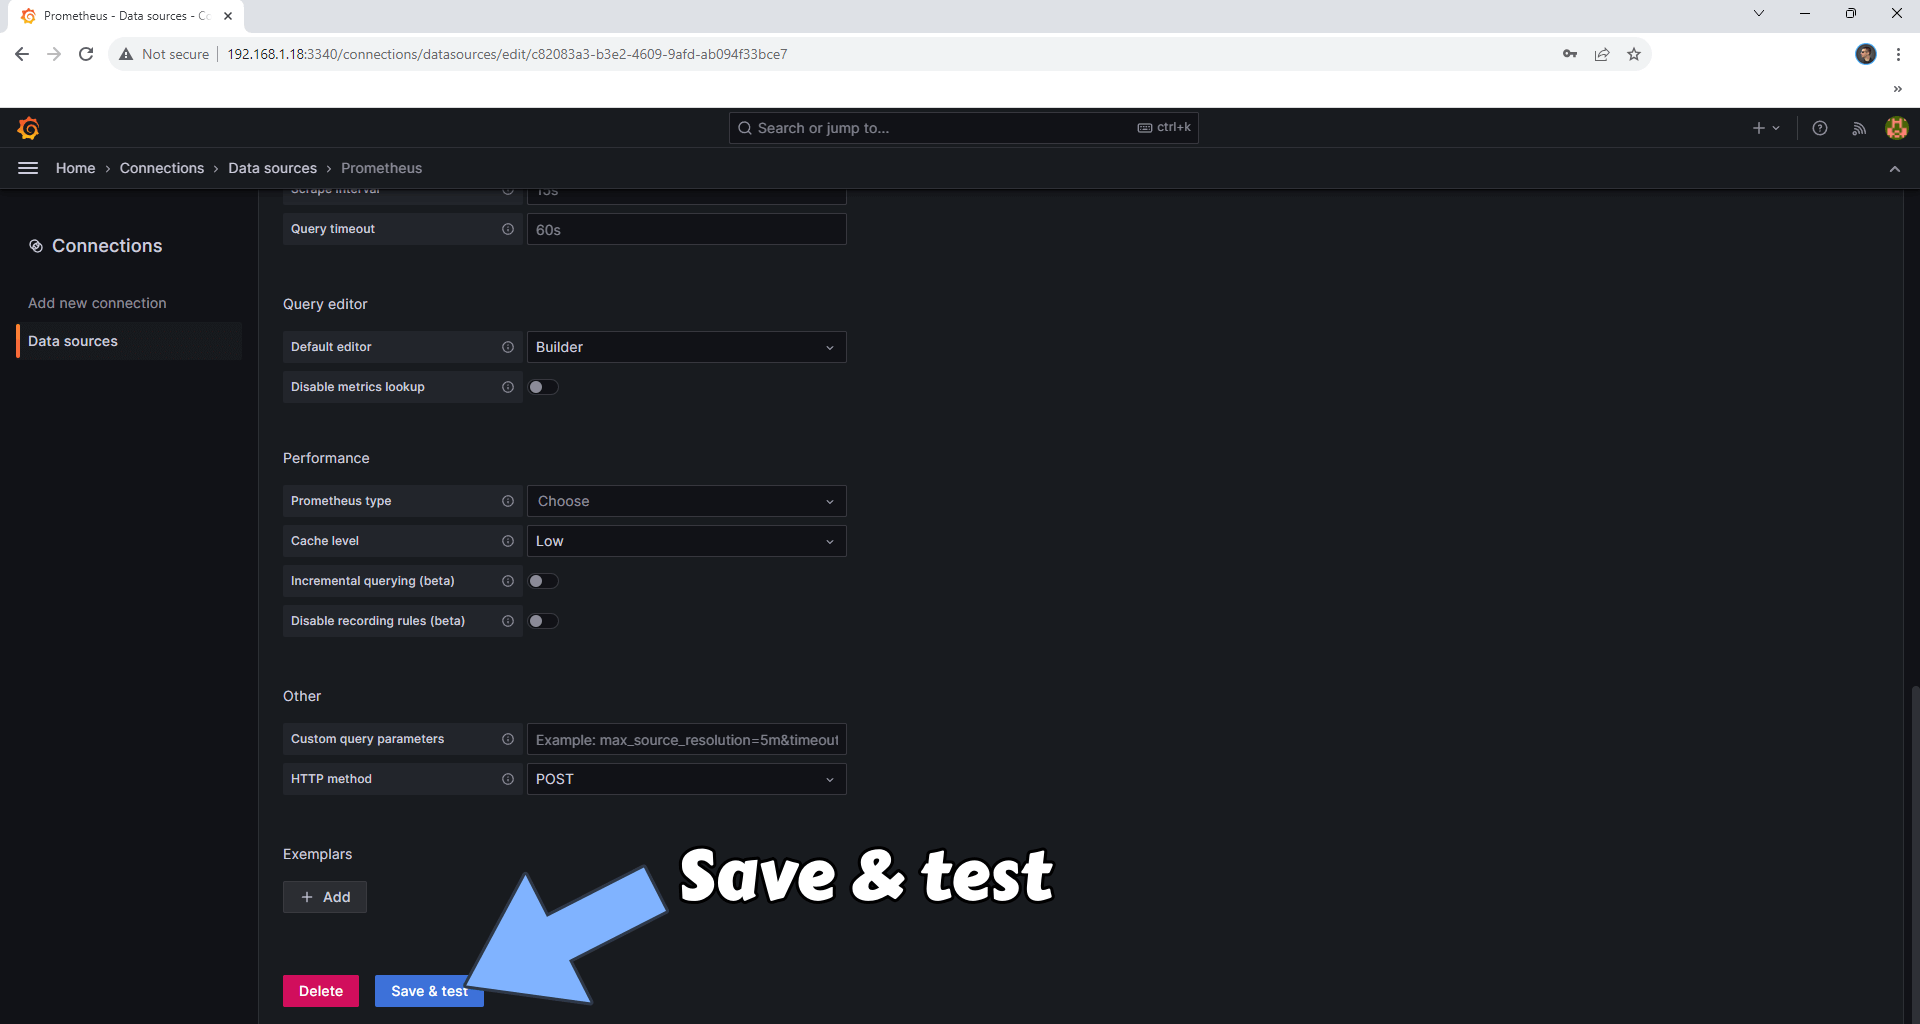
STEP 30
Click Save & test. Follow the instructions in the image below.
STEP 31
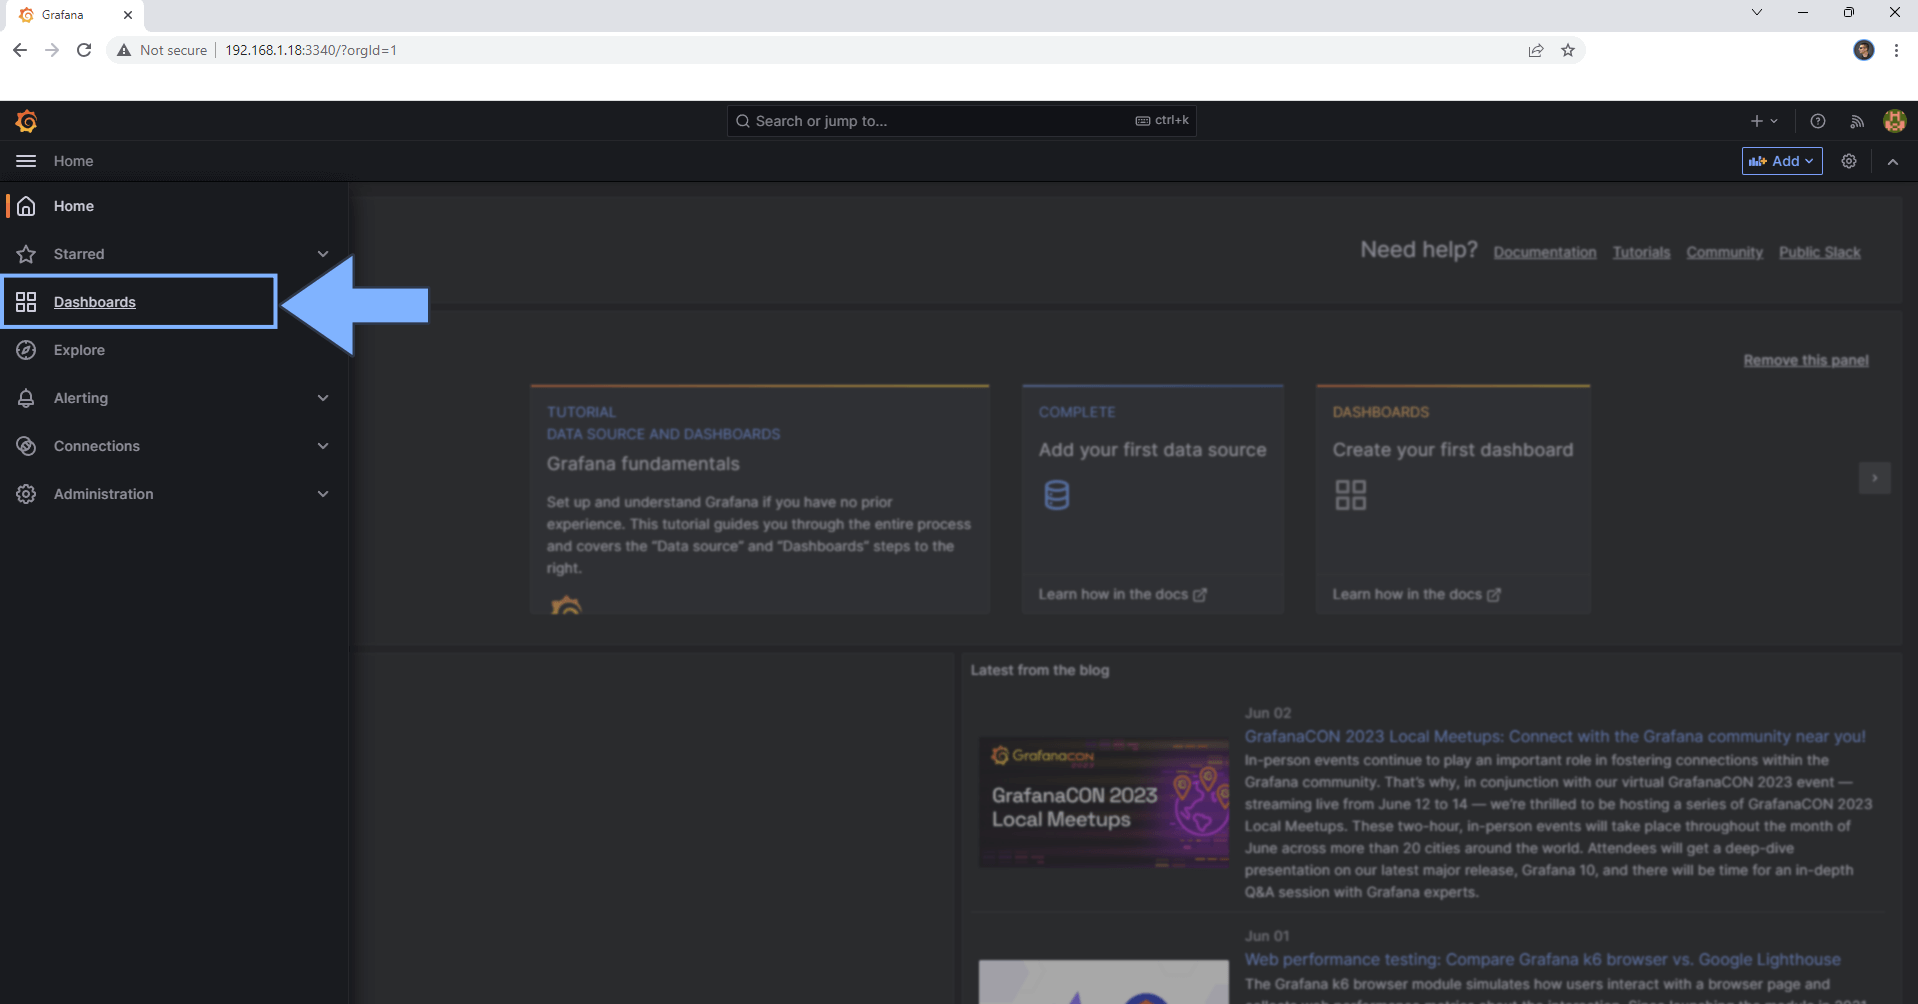
On the left sidebar, click Dashboards. Follow the instructions in the image below.
STEP 32
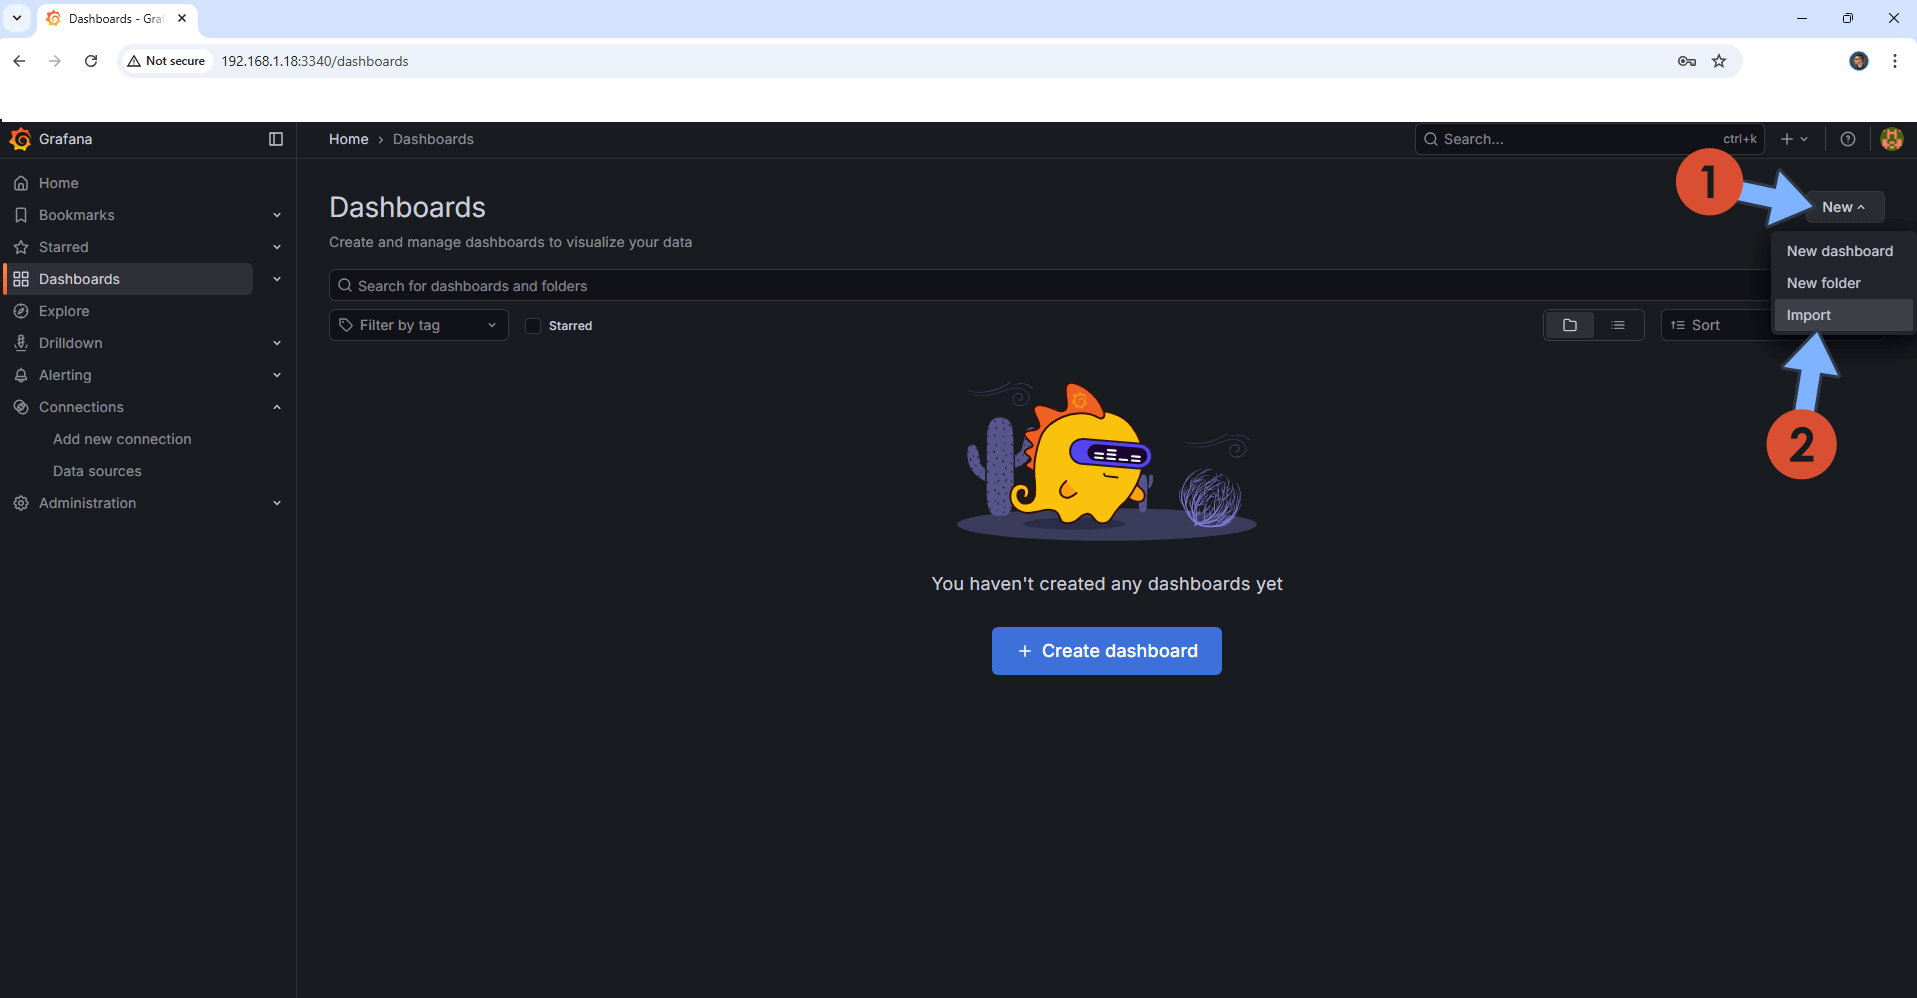
At the top right of the page, click New then Import. Follow the instructions in the image below.
STEP 33
Download (click on the blue link below) the Synology_Dashboard.json file. 🔒Note: Support my work to unlock the password. You can use this password to download any file on mariushosting forever!
STEP 34
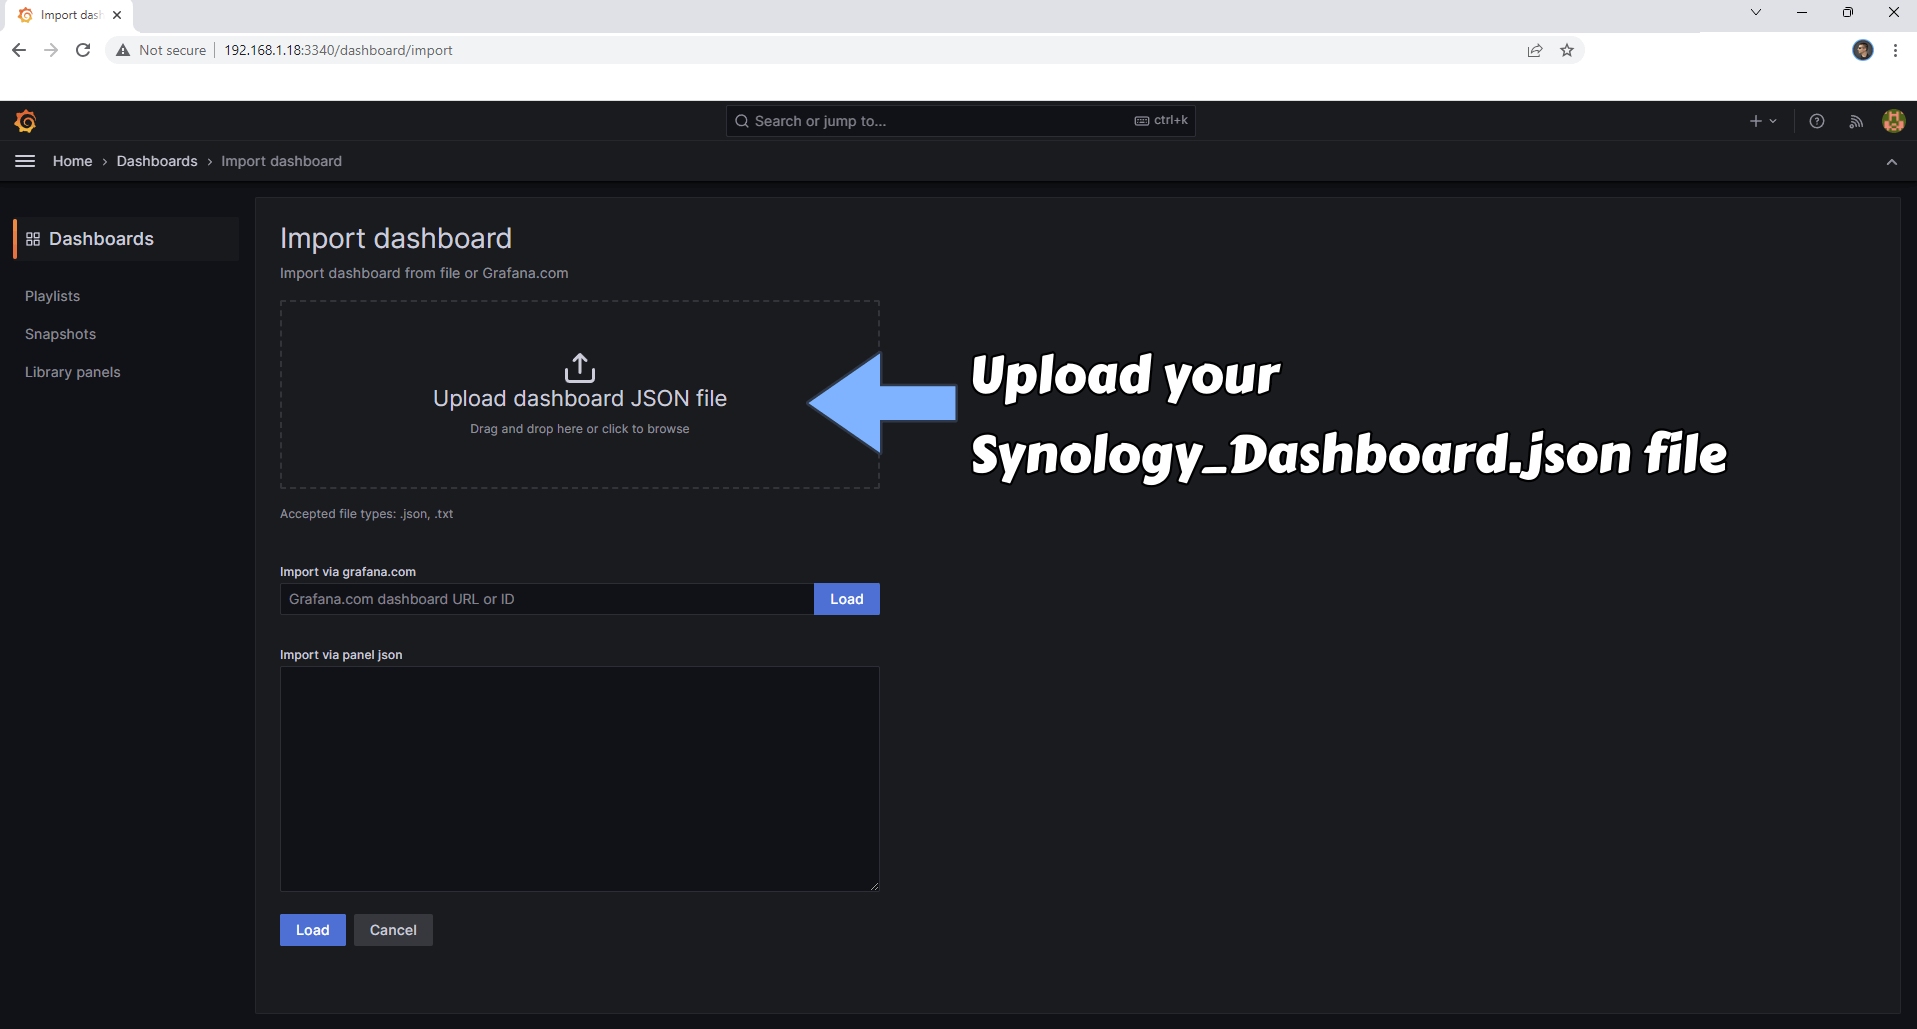
Click Upload dashboard JSON file and upload your Synology_Dashboard.json file that you have previously downloaded at STEP 33. Follow the instructions in the image below.
STEP 35
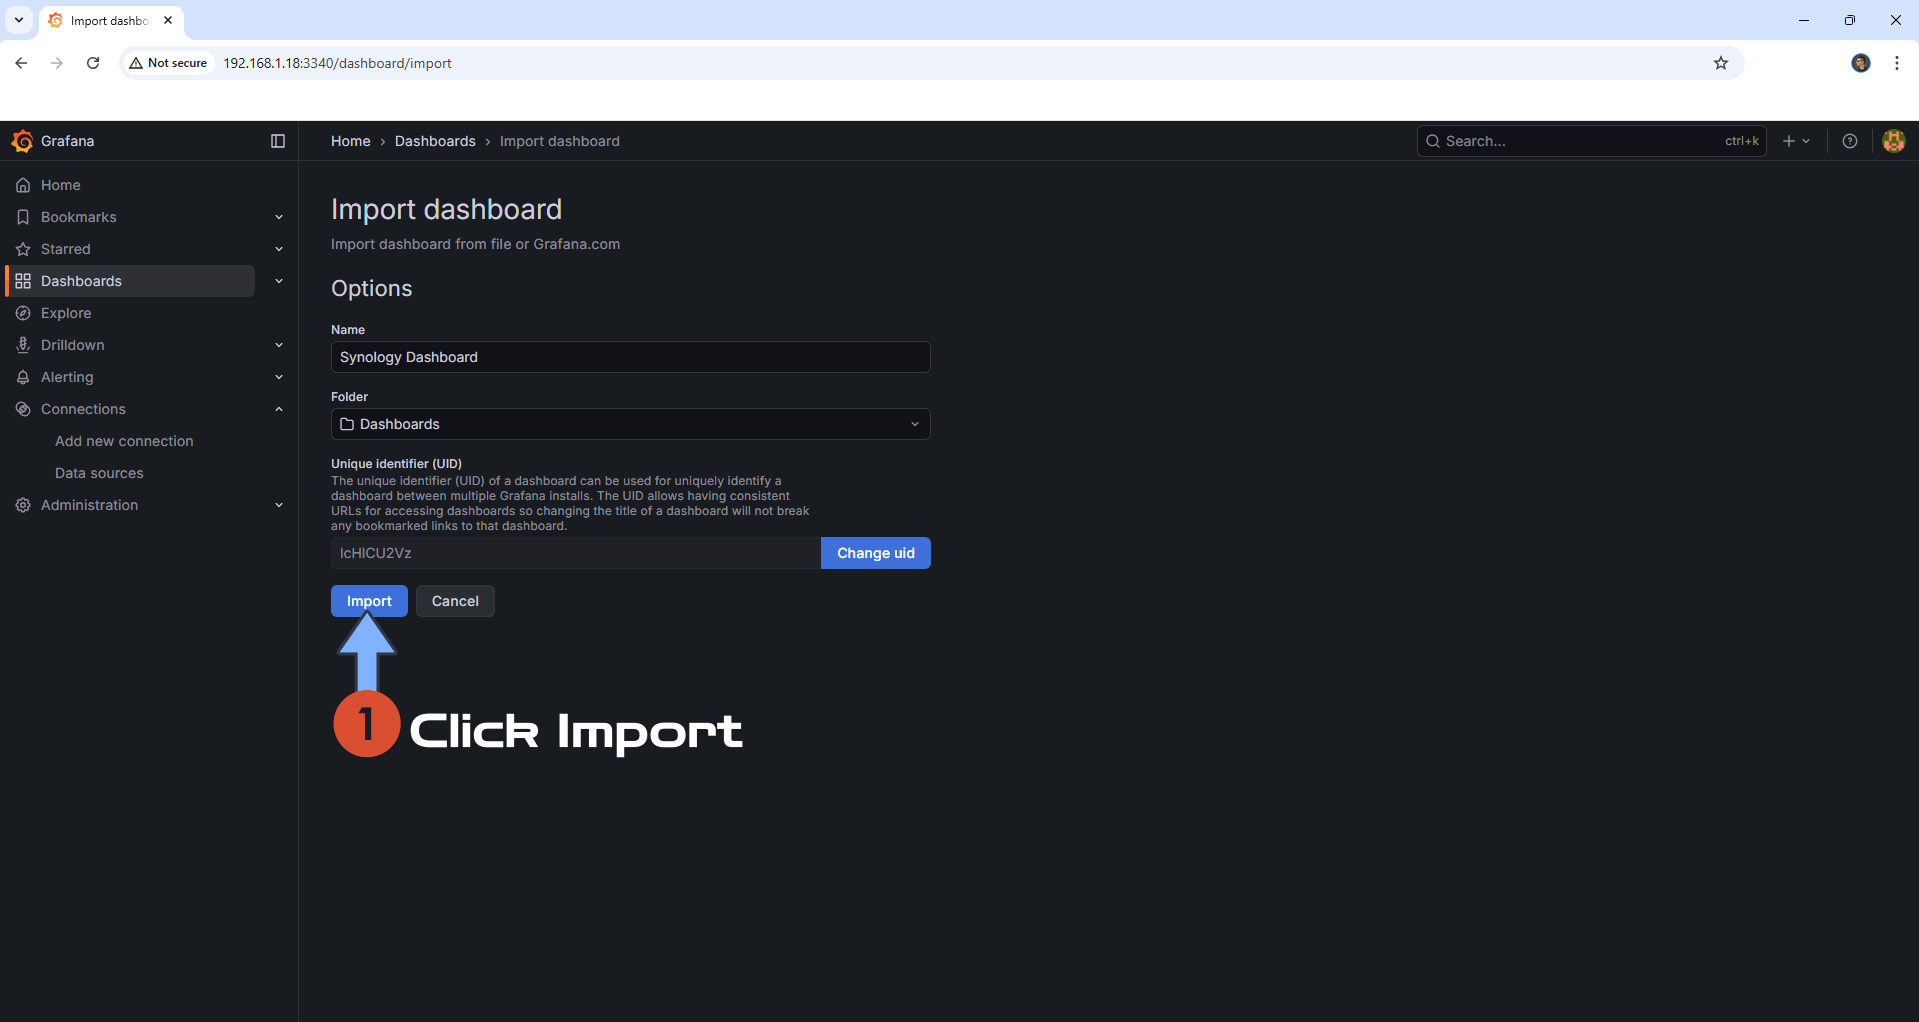
Click Import. Follow the instructions in the image below.
STEP 36
🟢Please Support My work by Making a Donation. Almost 99,9% of the people that install something using my guides forget to support my work, or just ignore STEP 1. I’ve been very honest about this aspect of my work since the beginning: I don’t run any ADS, I don’t require subscriptions, paid or otherwise, I don’t collect IPs, emails, and I don’t have any referral links from Amazon or other merchants. I also don’t have any POP-UPs or COOKIES. I have repeatedly been told over the years how much I have contributed to the community. It’s something I love doing and have been honest about my passion since the beginning. But I also Need The Community to Support me Back to be able to continue doing this work.
STEP 37
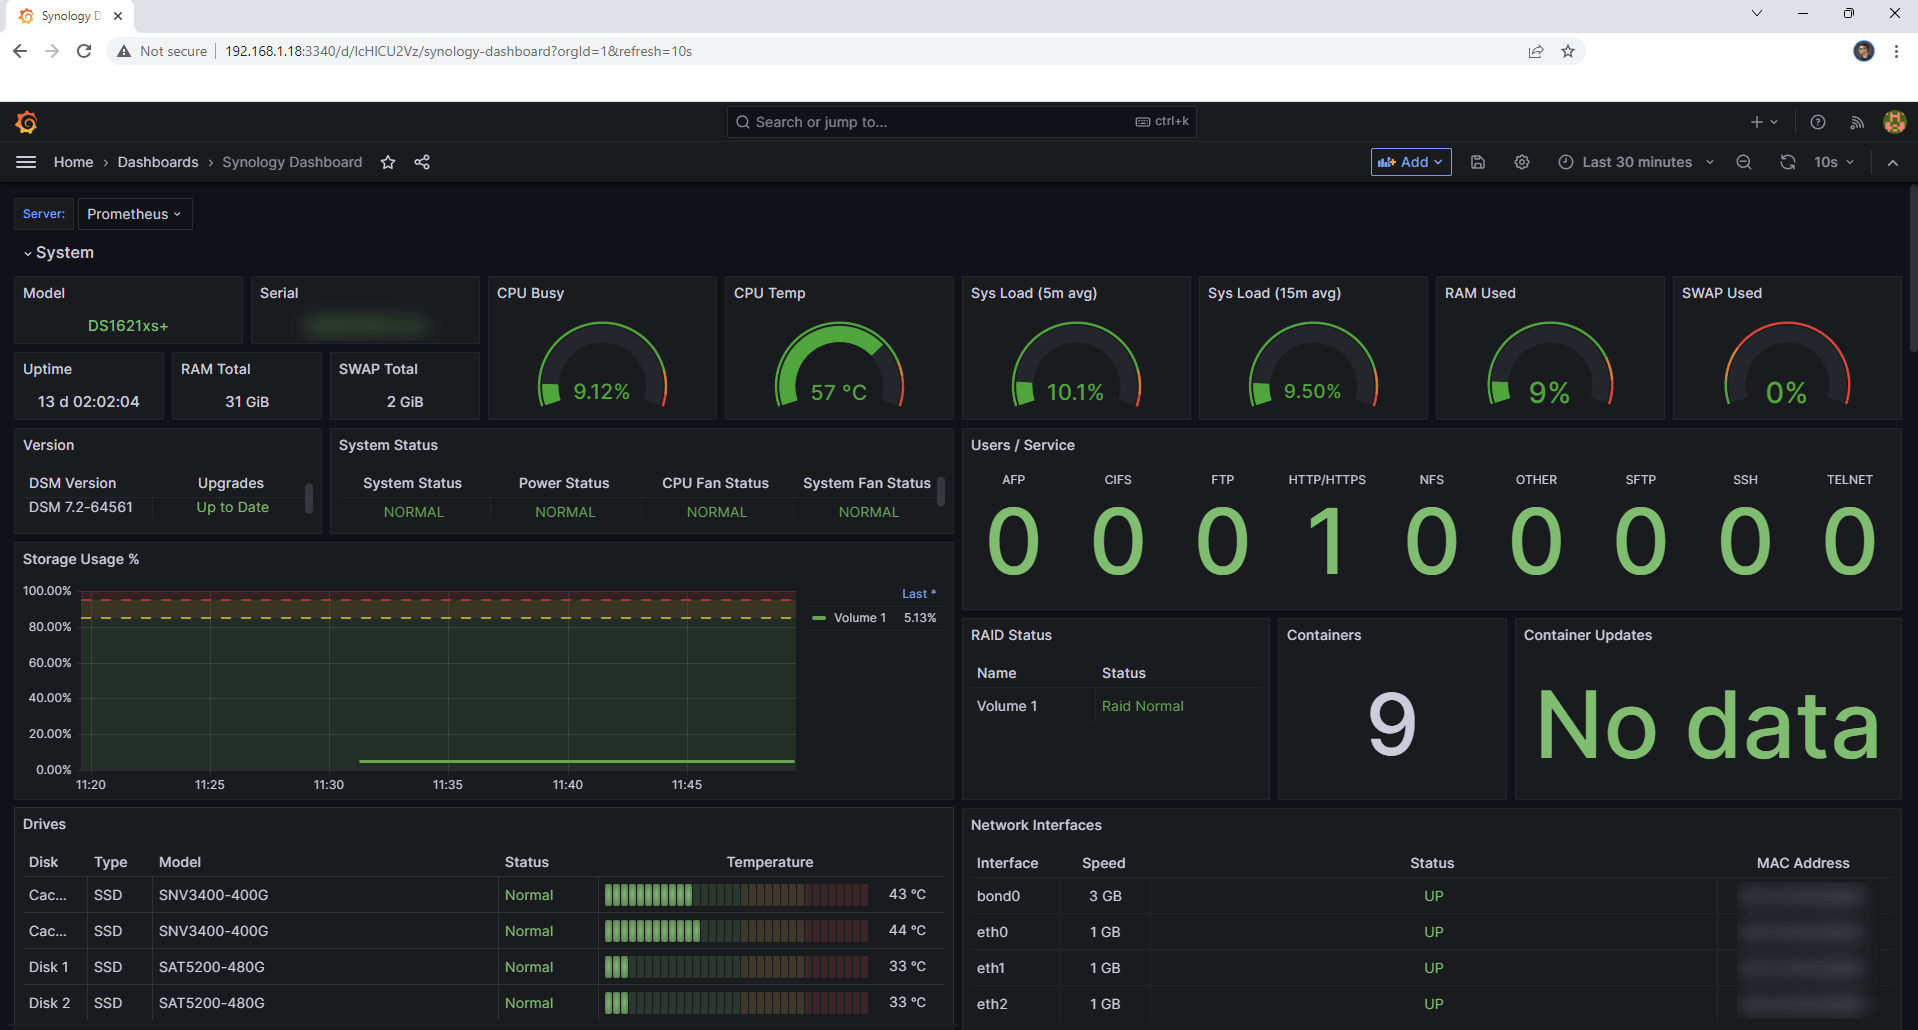
After you click Import, your Synology Dashboard will be ready! Note: Where you see No data, it means you don’t have Watchtower installed on your NAS using my Grafana and Prometheus Dashboard Part 3 guide. This space is reserved for monitoring containers updates in real time.
STEP 38
To add your Synology Dashboard to the Grafana homepage, click the star icon to add it to favorite. Follow the instructions in the image below.
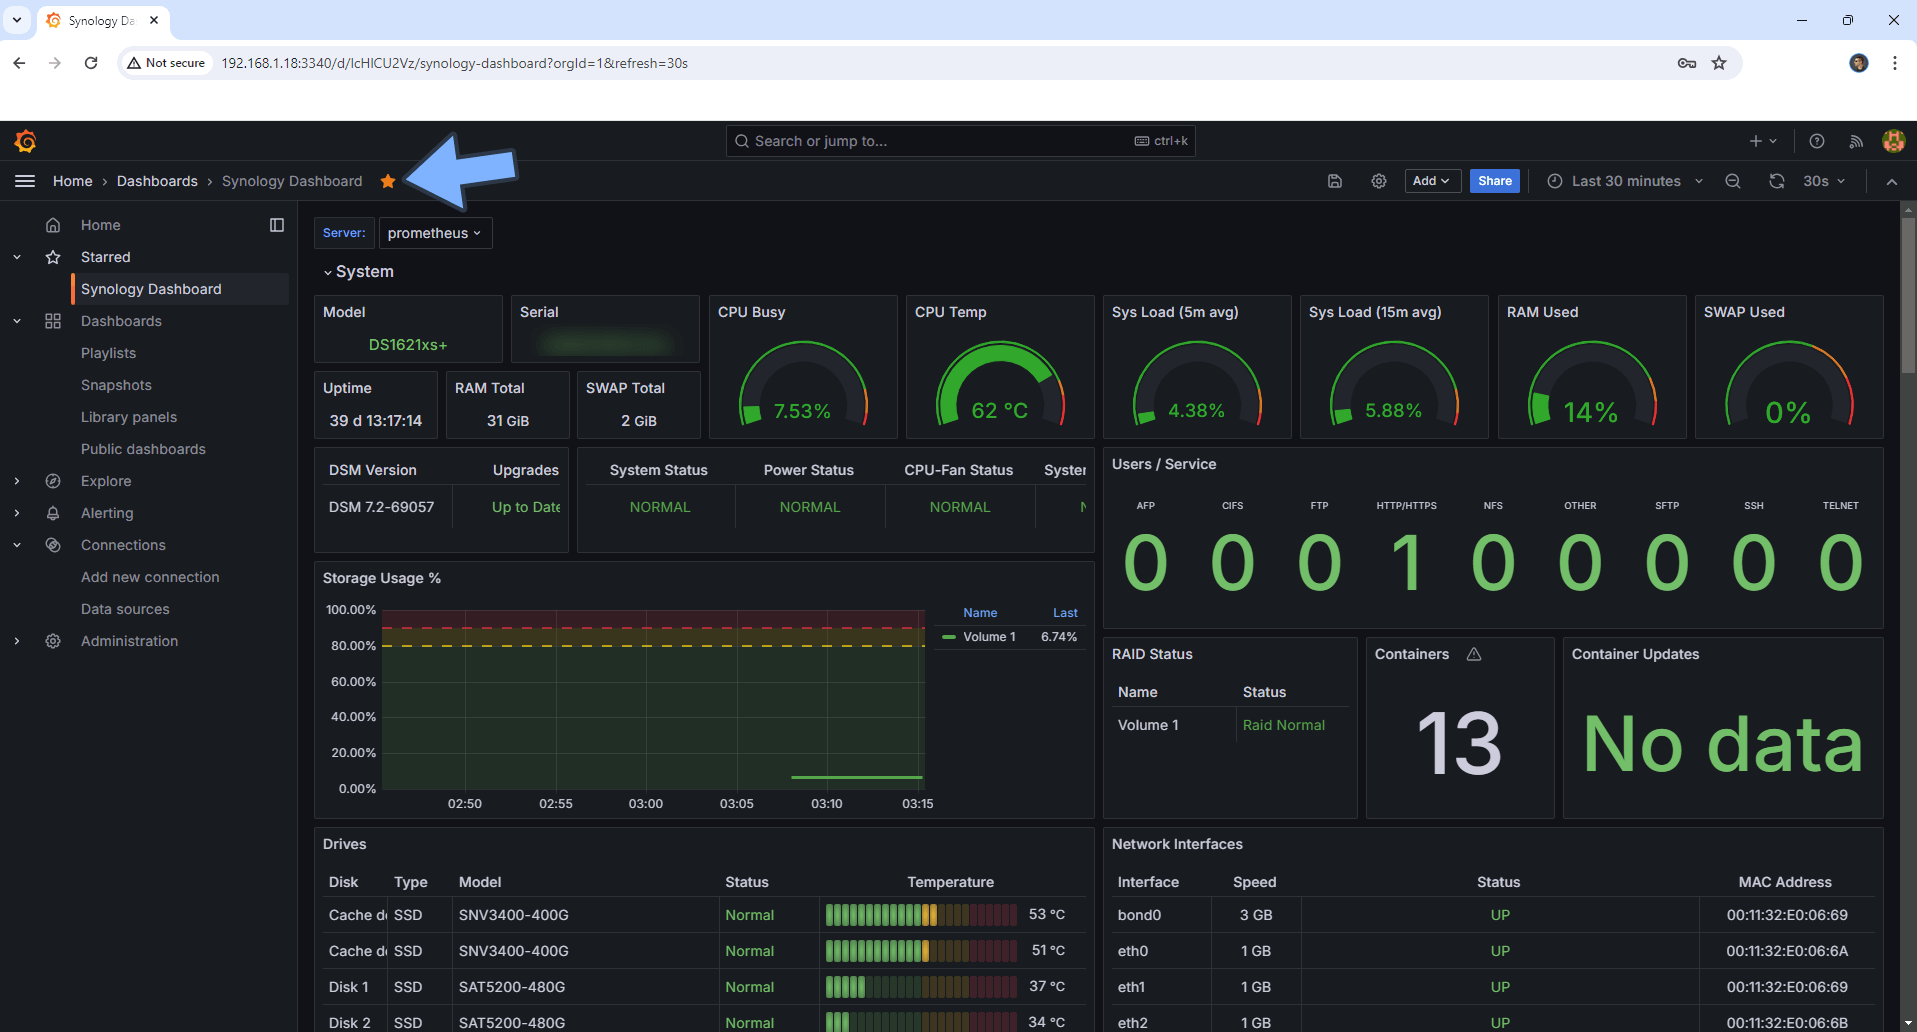
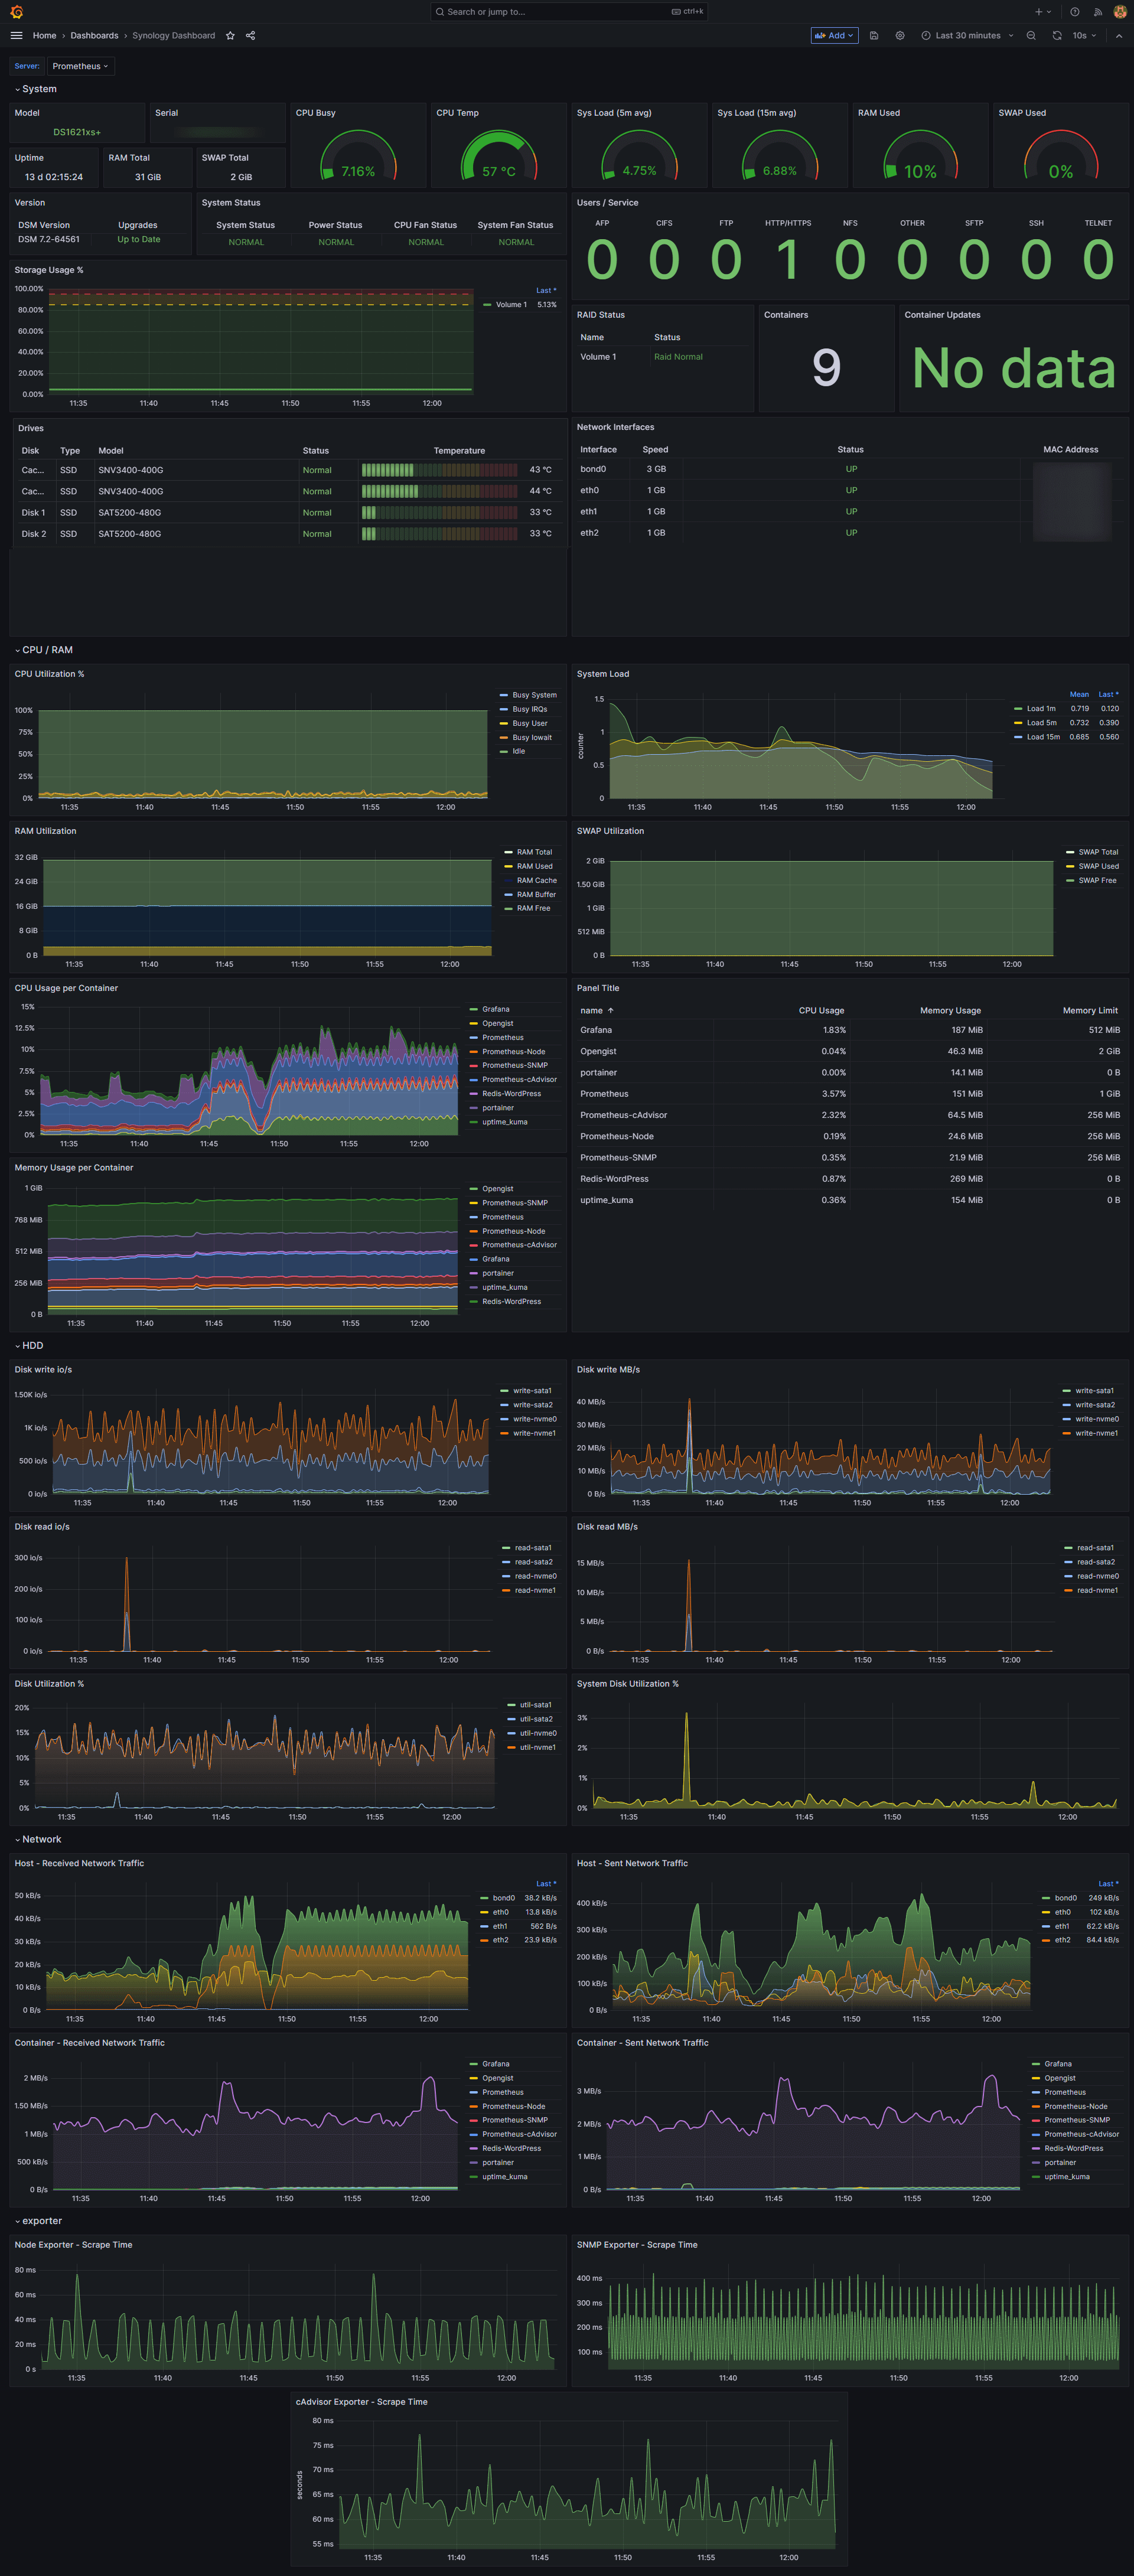
Your Synology Dashboard at a glance!
STEP 39
How to add more NAS devices metrics to your Grafana dashboard installed on your main NAS.
STEP 40
If you won’t be able to see all of your NAS data at STEP 16, instead of the IP address of your NAS add the address of your Docker bridge Gateway, which can be 172.17.0.1 – You will find Docker bridge by opening Docker or Container Manager then left sidebar / Network. Save the prometheus.yml file then restart all the containers in Portainer.
STEP 41
If you get an error message that says: Error: ✗ Get “https://grafana.com/api/plugins/grafana-clock-panel/versions”: context deadline exceeded (Client.Timeout exceeded while awaiting headers)
Just add a # before GF_INSTALL_PLUGINS: grafana-clock-panel,grafana-simple-json-datasource,natel-discrete-panel,grafana-piechart-panel in the docker compose at STEP 21. In other words, from:
GF_INSTALL_PLUGINS: grafana-clock-panel,grafana-simple-json-datasource,natel-discrete-panel,grafana-piechart-panel
to
#GF_INSTALL_PLUGINS: grafana-clock-panel,grafana-simple-json-datasource,natel-discrete-panel,grafana-piechart-panel⚠️Warning: If your Prometehus-cAdvisor container does not work, with an exited code, on the URL area at STEP 29, type in http://NASIP:9090/ instead of http://prometheus-server:9090/
⚠️Warning: Not fully compatible with DSM 6.
Enjoy your awesome Synology Dashboard powered by Grafana and Prometheus!
Note: If you want to run the Grafana container over HTTPS, check out my guide on How to Run Docker Containers Over HTTPS.
Note: Can I run Docker on my Synology NAS? See the supported models.
Note: How to Back Up Docker Containers on your Synology NAS.
Note: Find out how to update the Grafana and Prometheus containers with the latest image.
Note: How to Free Disk Space on Your NAS if You Run Docker.
Note: How to Schedule Start & Stop For Docker Containers.
Note: How to Activate Email Notifications.
Note: How to Add Access Control Profile on Your NAS.
Note: How to Change Docker Containers Restart Policy.
Note: How to Use Docker Containers With VPN.
Note: Convert Docker Run Into Docker Compose.
Note: How to Clean Docker.
Note: How to Clean Docker Automatically.
Note: Best Practices When Using Docker and DDNS.
Note: Some Docker Containers Need WebSocket.
Note: Find out the Best NAS Models For Docker.
Note: Activate Gmail SMTP For Docker Containers.
This post was updated on Friday / April 10th, 2026 at 12:42 AM