Have you installed Grafana monitored by Prometheus following my step by step guide to display system metrics for your Synology NAS server? Have you installed Prometheus on your second or third NAS device? In this step by step guide I will show you how to integrate Watchtower in the Grafana Dashboard. When it came to my First and Second guides, people complained they had No data showing on the Container Updates area. So today I will teach you how to display Watchtower data on your Container Updates area so you can Fully Enjoy your Synology Dashboard.

What is Watchtower? Watchtower is a Docker application that monitors your running containers for changes to the image. When an update is available in the Docker registry, Watchtower detects the changes and pulls down the new copy of the image. It will then restart the container using the new image and the same start options of the original, without you losing any data.
STEP 1
Please Support My work by Making a Donation.
STEP 2
If you already have the Watchtower container installed on your Synology NAS, it’s mandatory to delete it first and then install it again using my guide below. If you don’t have Watchtower installed on your NAS, skip this STEP.
STEP 3
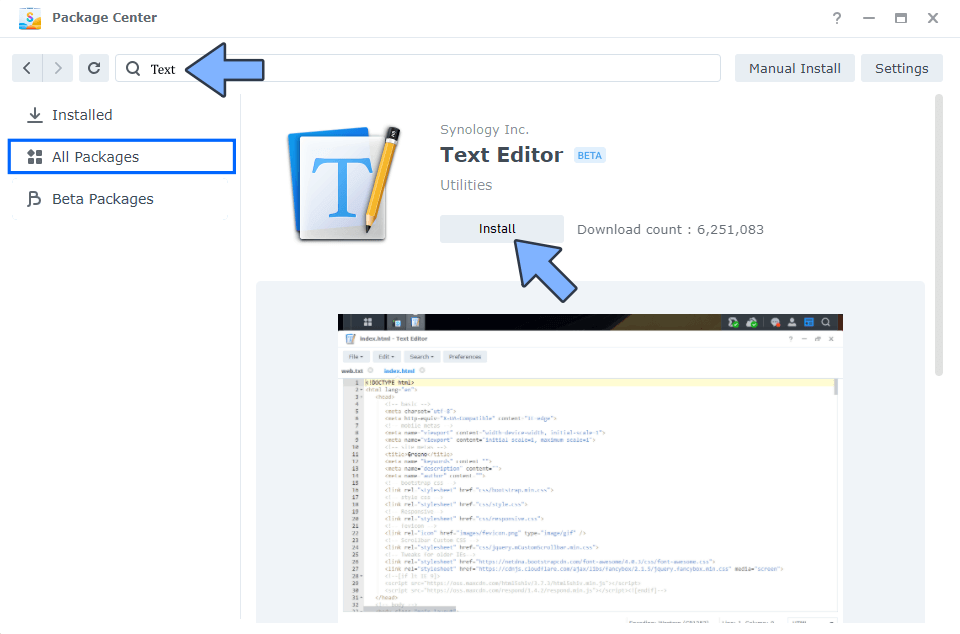
Install Text Editor via Synology “Package Center”. (Mandatory STEP.) If you already have Text Editor installed on your Synology NAS, skip this STEP.
STEP 3
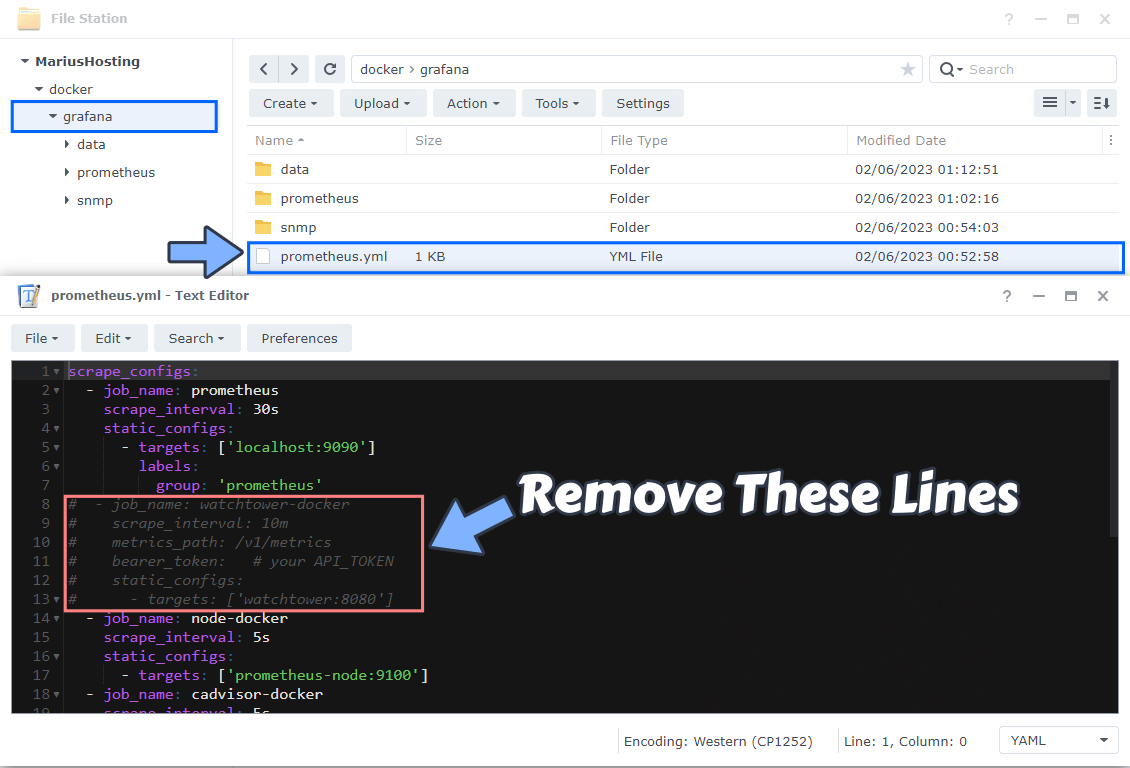
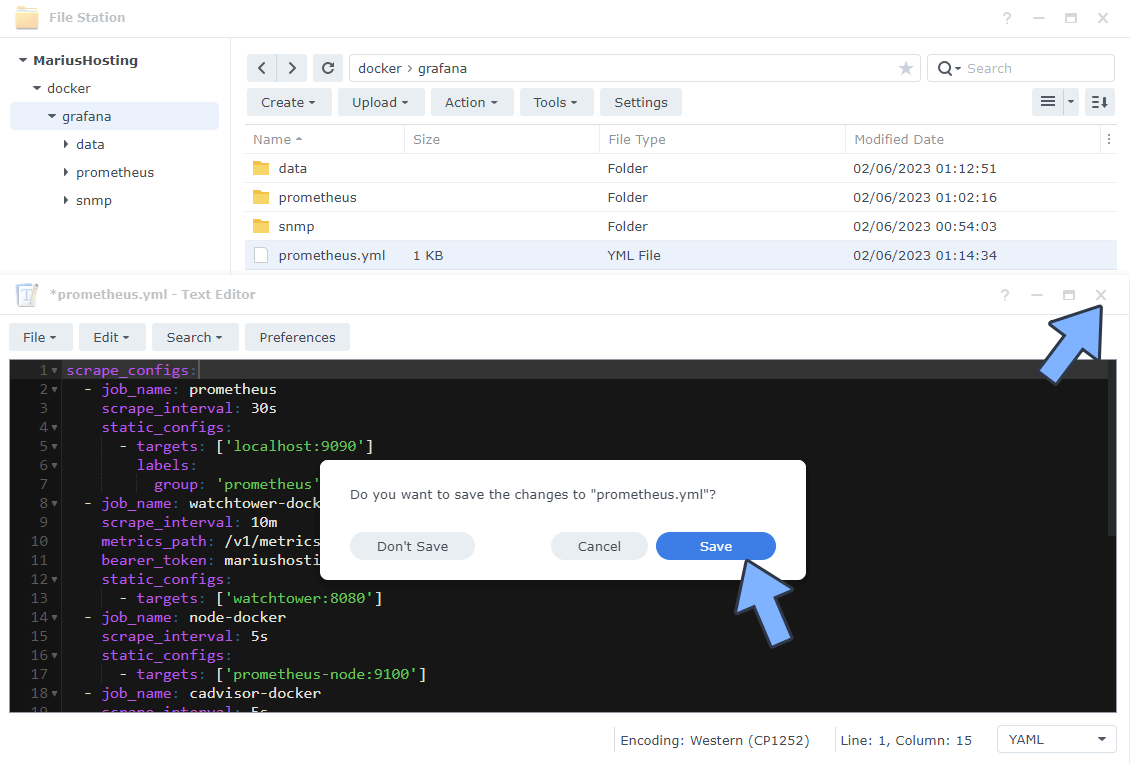
Open the prometehus.yml file that you have in File Station. Remove these lines below:
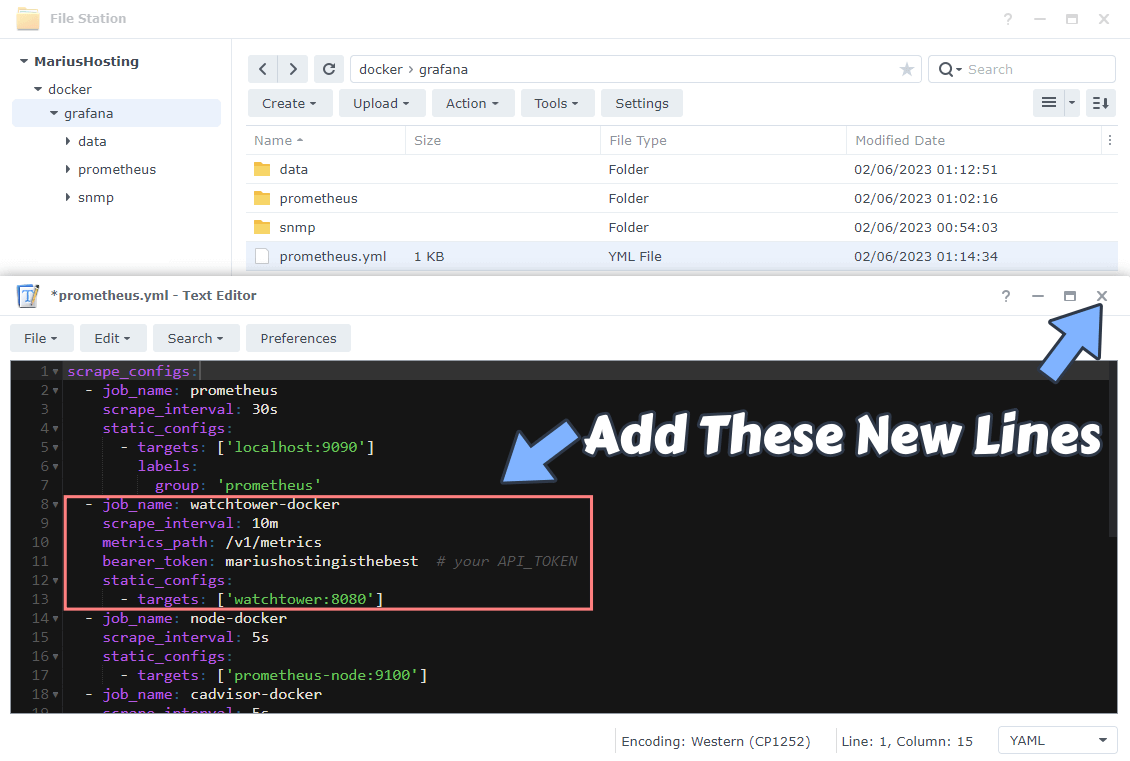
And replace with these lines below.
  - job_name: watchtower-docker
    scrape_interval: 10m
    metrics_path: /v1/metrics
    bearer_token: mariushostingisthebest  # your API_TOKEN
    static_configs:
      - targets: ['watchtower:8080']
See the example in the image below.
STEP 4
Click X to save the file. Click Save to save the file. Follow the instructions in the image below.
STEP 5
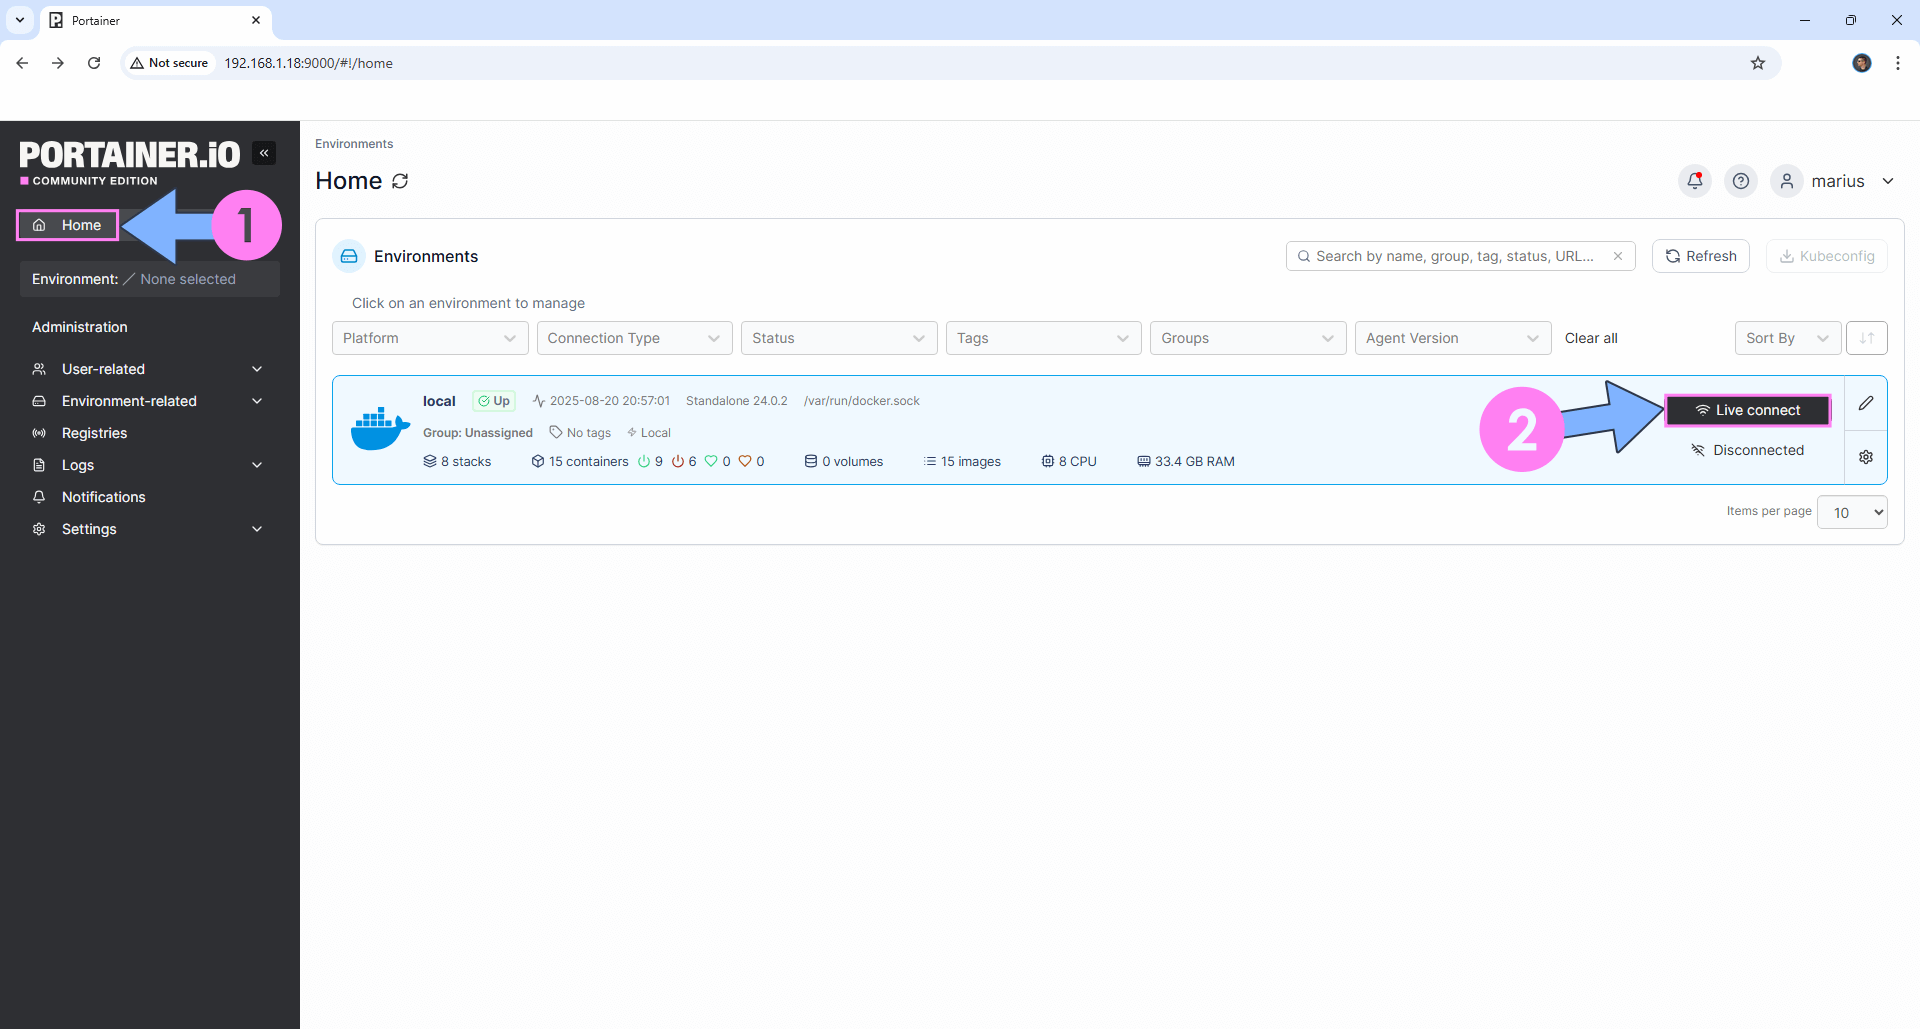
Log into Portainer using your username and password. On the left sidebar in Portainer, click on Home then Live connect. Follow the instructions in the image below.
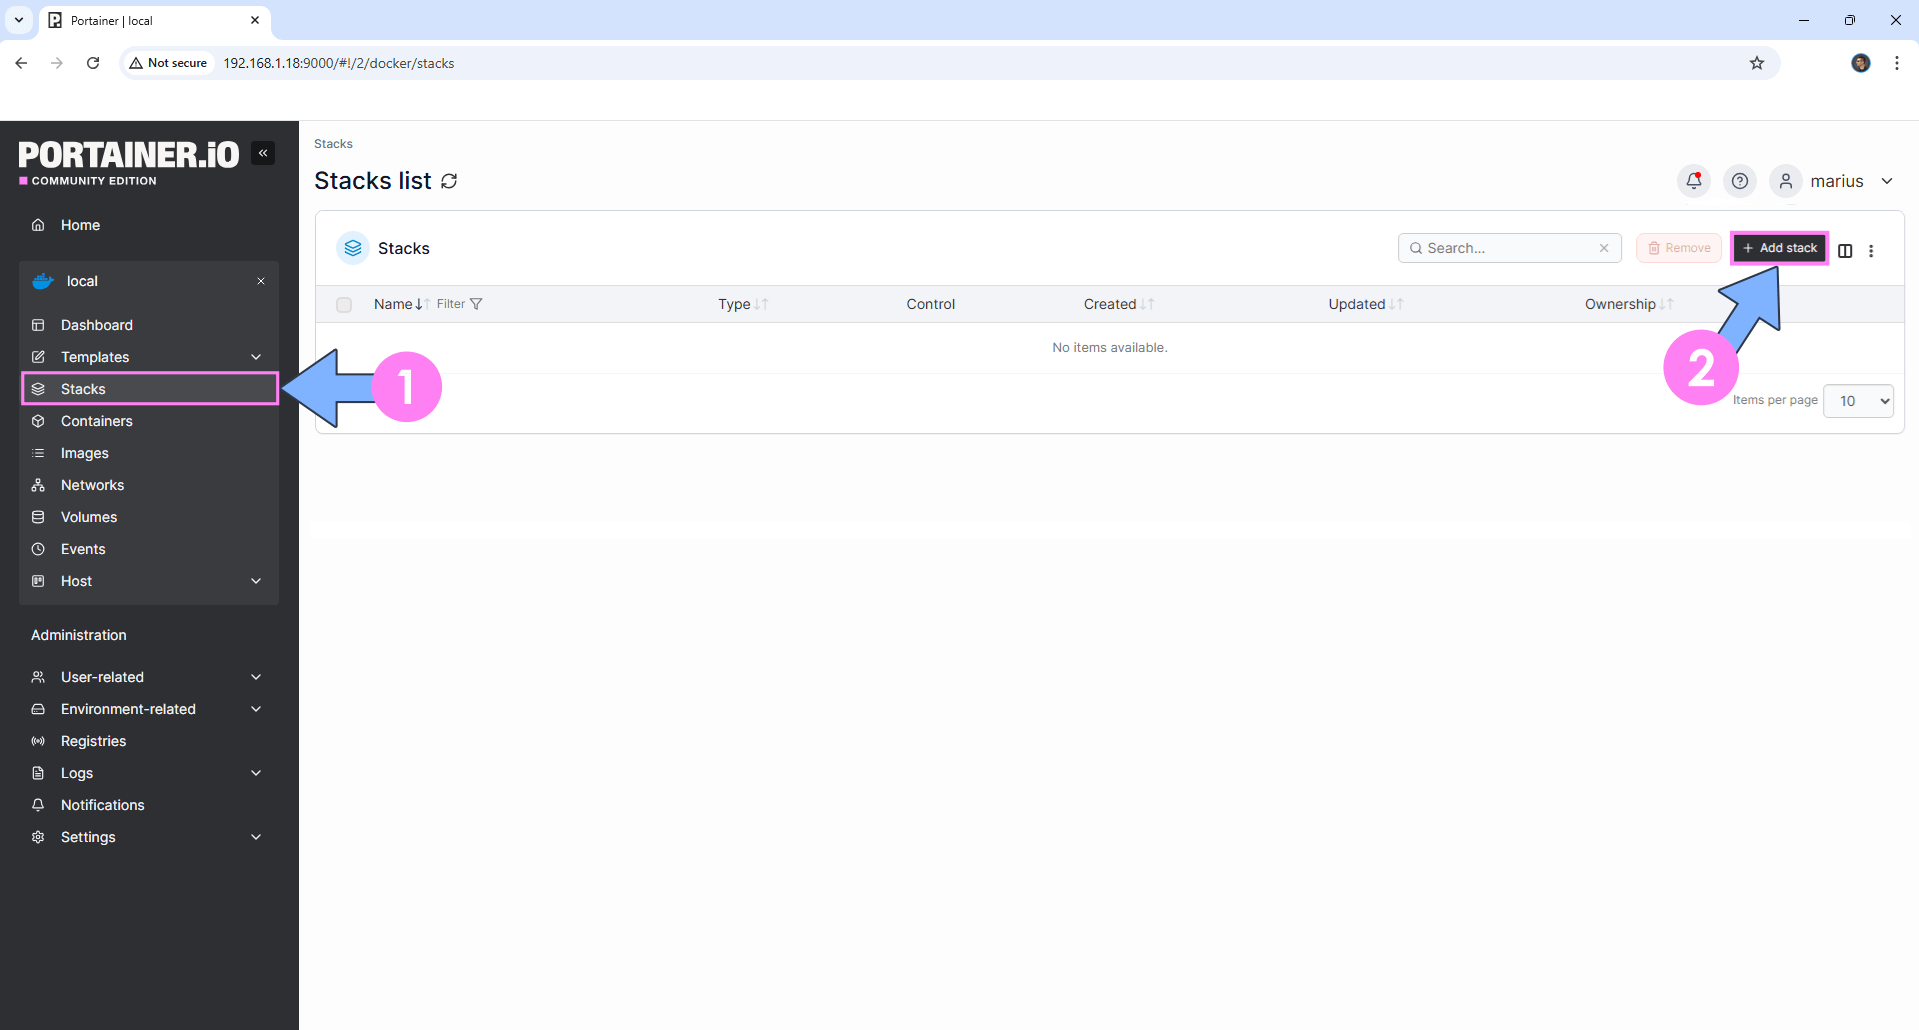
On the left sidebar in Portainer, click on Stacks then + Add stack. Follow the instructions in the image below.
STEP 6
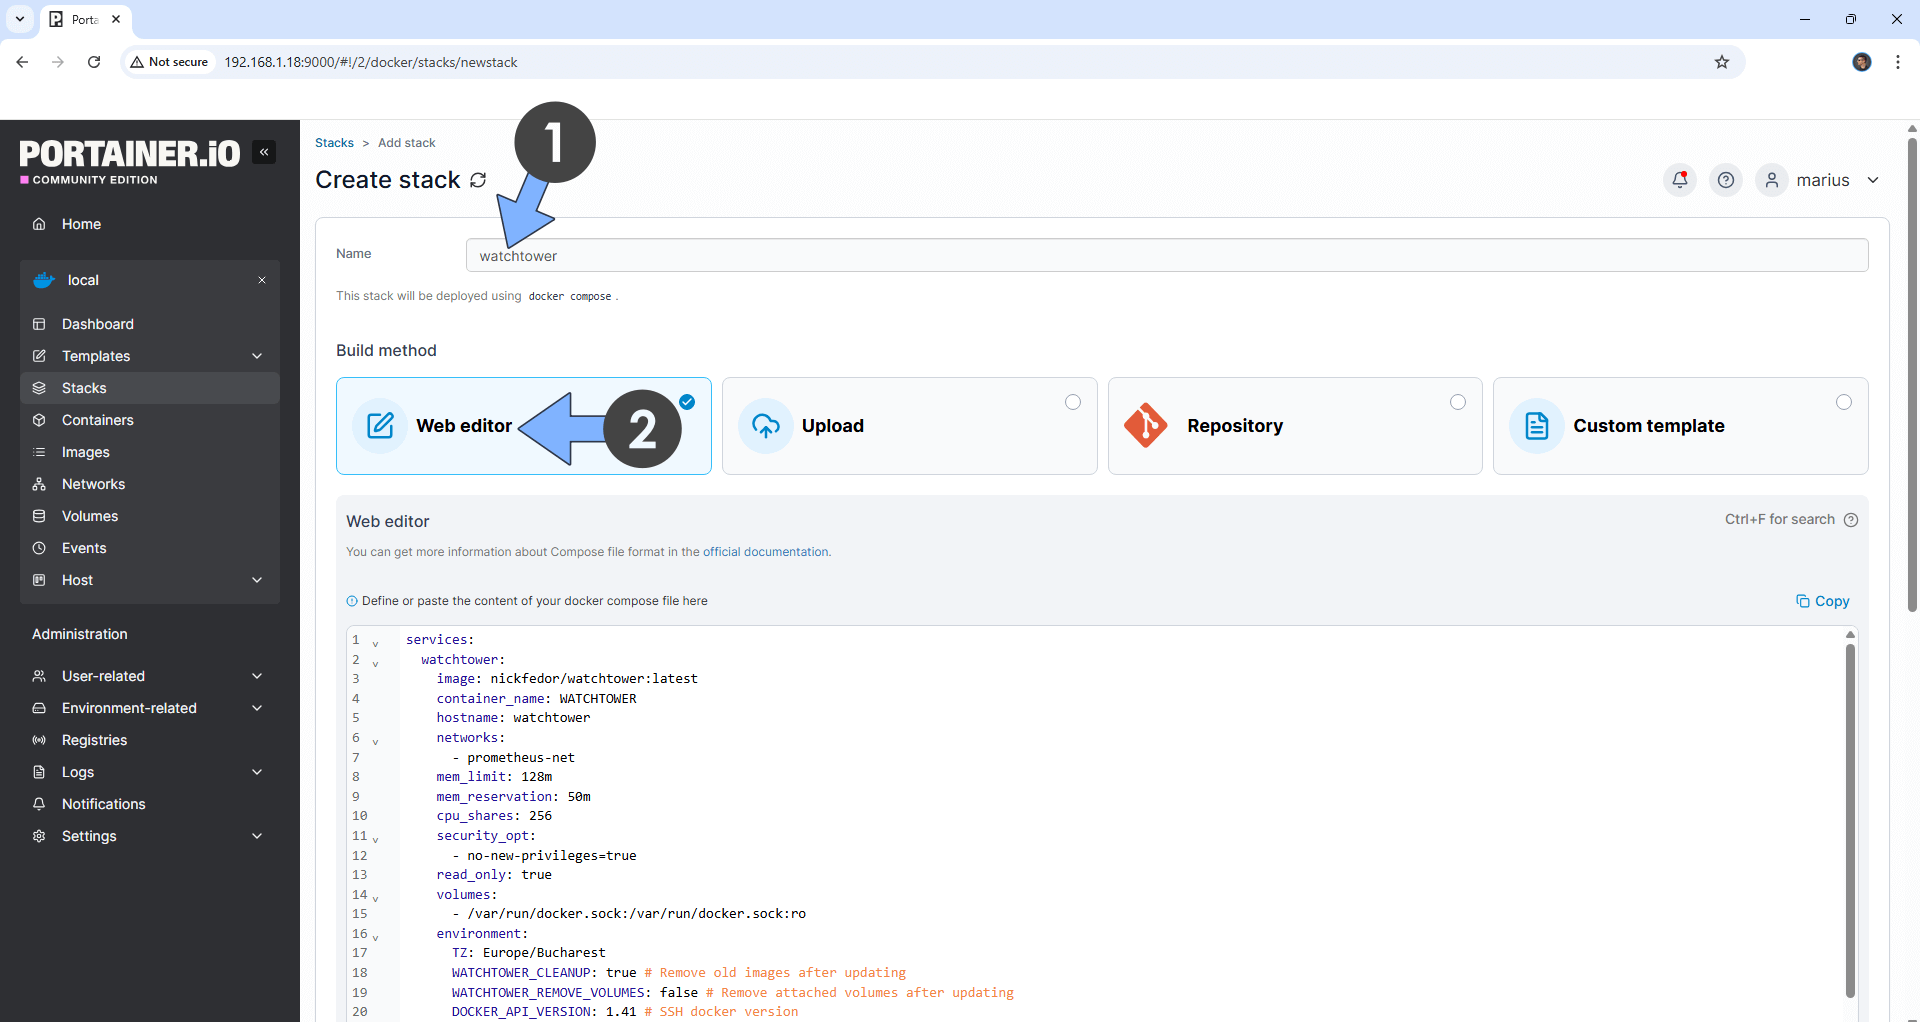
In the Name field type in watchtower. Follow the instructions in the image below.
services:
  watchtower:
    image: nickfedor/watchtower:latest
    container_name: WATCHTOWER
    hostname: watchtower
    networks:
      - prometheus-net
    mem_limit: 128m
    mem_reservation: 50m
    cpu_shares: 256
    security_opt:
      - no-new-privileges=true
    read_only: true
    volumes:
      - /var/run/docker.sock:/var/run/docker.sock:ro
    environment:
      TZ: Europe/Bucharest
      WATCHTOWER_CLEANUP: true # Remove old images after updating
      WATCHTOWER_REMOVE_VOLUMES: false # Remove attached volumes after updating
      DOCKER_API_VERSION: 1.41 # SSH docker version
      WATCHTOWER_INCLUDE_RESTARTING: true # Restart containers after update
      WATCHTOWER_INCLUDE_STOPPED: false # Update stopped containers
      WATCHTOWER_SCHEDULE: "0 0 */2 * * *" # Update & Scan containers every 2 hours
      WATCHTOWER_LABEL_ENABLE: false
      WATCHTOWER_ROLLING_RESTART: true #or false if you are using containers that have depends_on.
      WATCHTOWER_TIMEOUT: 30s
      WATCHTOWER_HTTP_API_METRICS: true # Metrics for Prometheus
      WATCHTOWER_HTTP_API_TOKEN: mariushostingisthebest # Token for Prometheus
    restart: on-failure:5

networks:
  prometheus-net:
    external: true
Note: Before you paste the code above in the Web editor area below, change the value for TZ (Select your current Time Zone from this list).
Note: Before you paste the code above in the Web editor area below, change the value for DOCKER_API_VERSION. 1.41 is for Docker engine 20.10 – 1.43 is for Docker engine 24. Check the exact version on the official Docker engine API website.
Note: If you want, you can change some parameters in the code above such as the frequency with which your containers get scanned and updated.
STEP 7
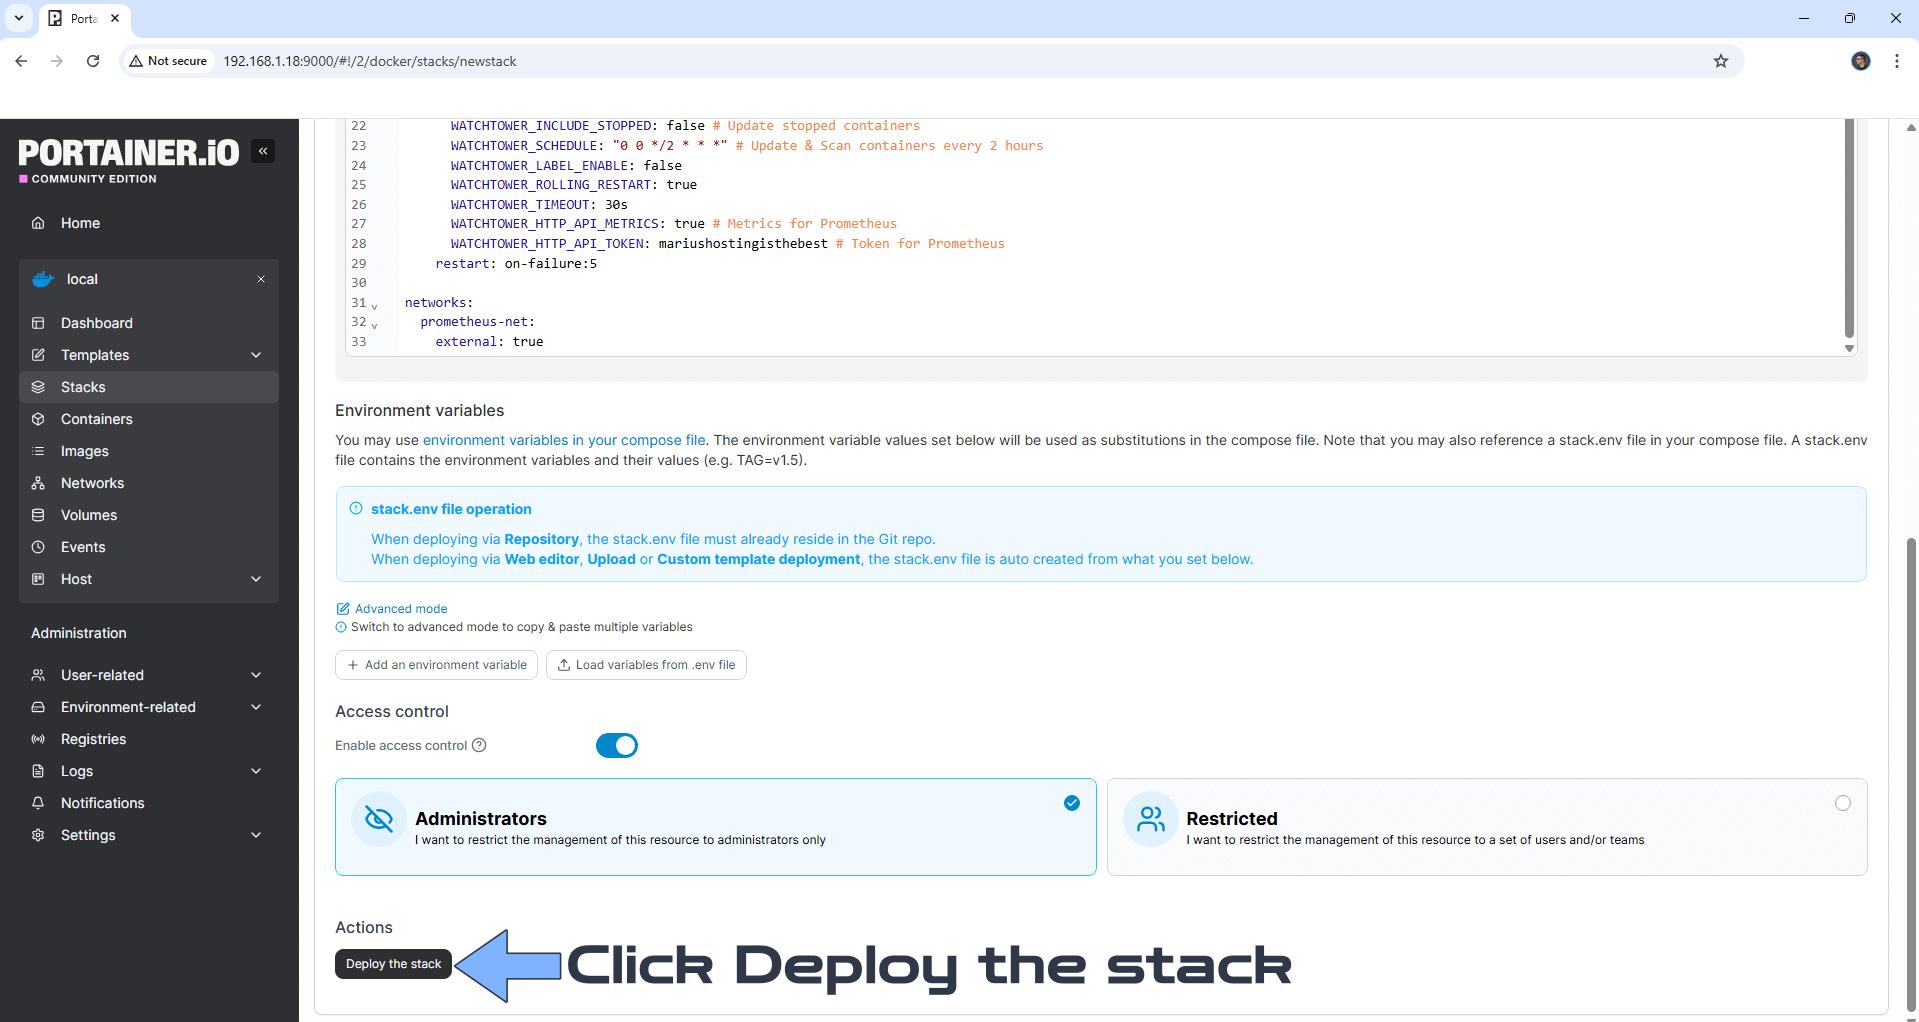
Scroll down on the page until you see a button named Deploy the stack. Click on it. Follow the instructions in the image below. The installation process can take up to a few minutes. It will depend on your Internet speed connection.
STEP 8
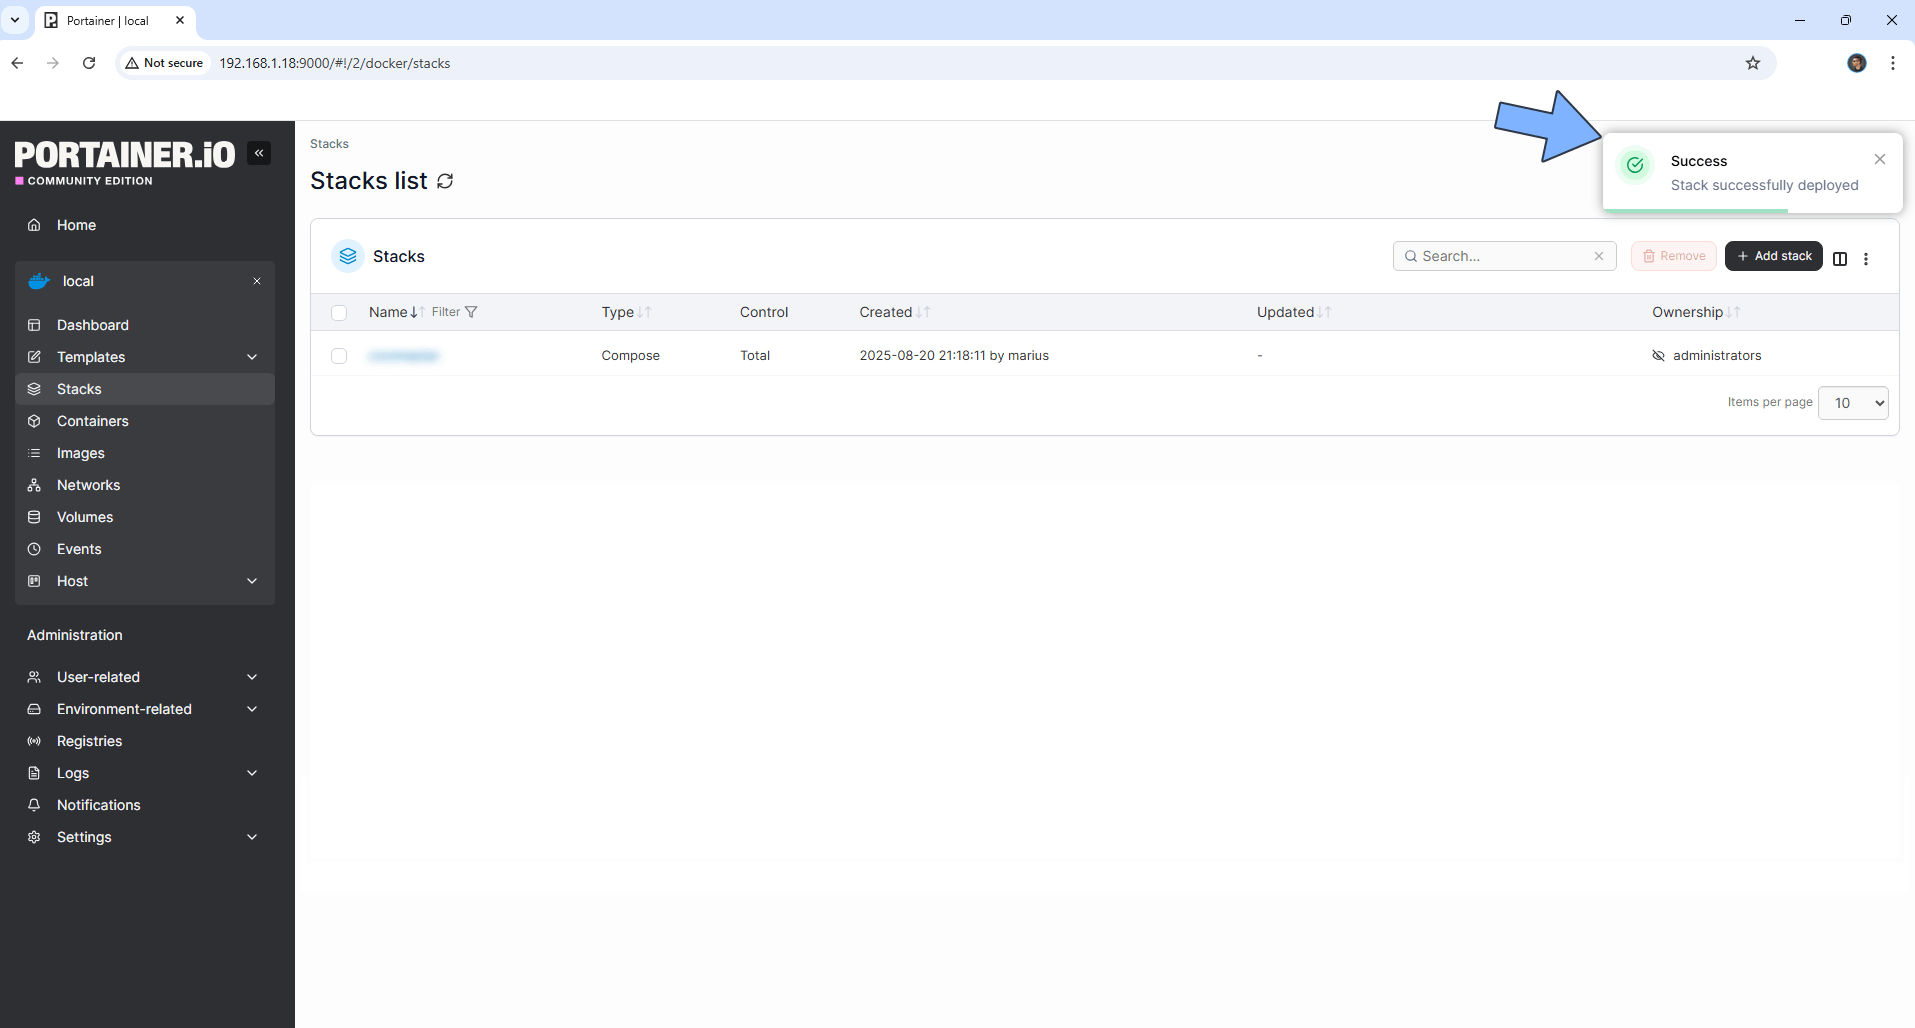
If everything goes right, you will see this message at the top right of your screen: “Success Stack successfully deployed“.
STEP 9
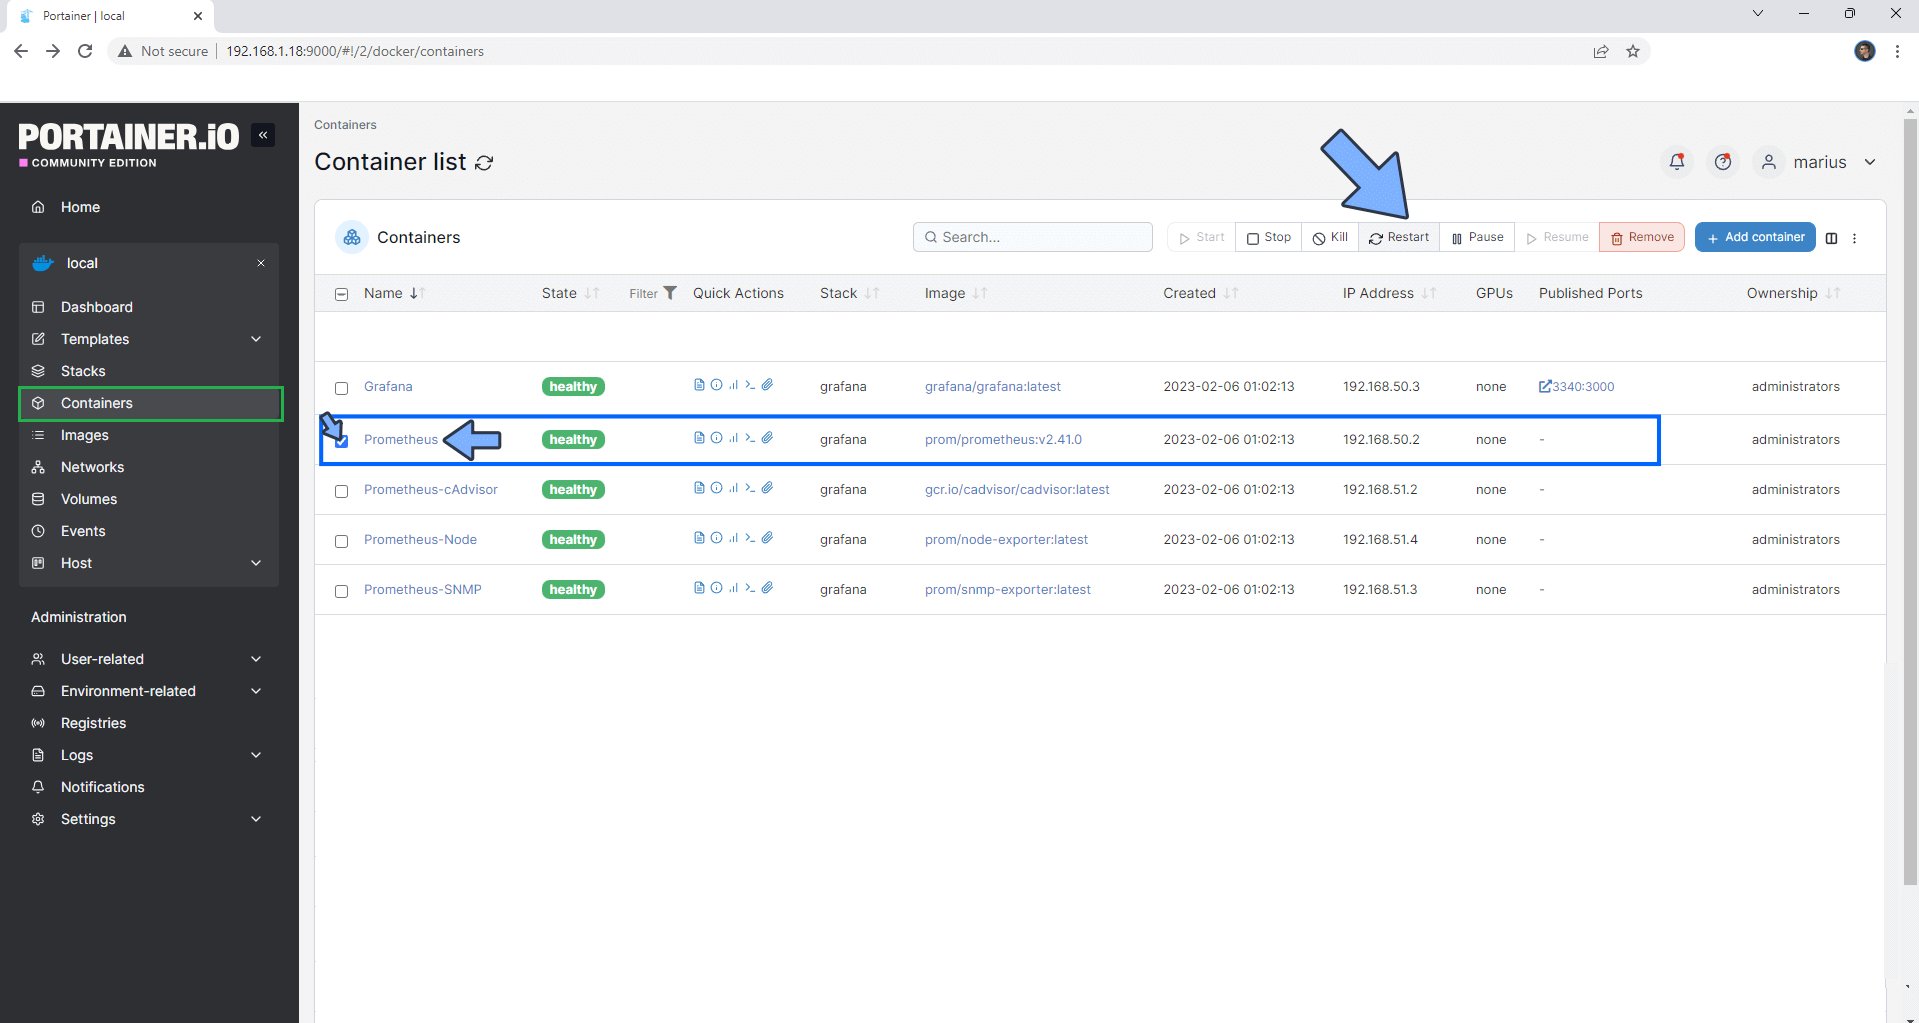
On the left sidebar in Portainer, click Containers. Identify your Prometheus instance, select it then click Restart. Follow the instructions in the image below.
STEP 10
🟢Please Support My work by Making a Donation. Almost 99,9% of the people that install something using my guides forget to support my work, or just ignore STEP 1. I’ve been very honest about this aspect of my work since the beginning: I don’t run any ADS, I don’t require subscriptions, paid or otherwise, I don’t collect IPs, emails, and I don’t have any referral links from Amazon or other merchants. I also don’t have any POP-UPs or COOKIES. I have repeatedly been told over the years how much I have contributed to the community. It’s something I love doing and have been honest about my passion since the beginning. But I also Need The Community to Support me Back to be able to continue doing this work.
STEP 11
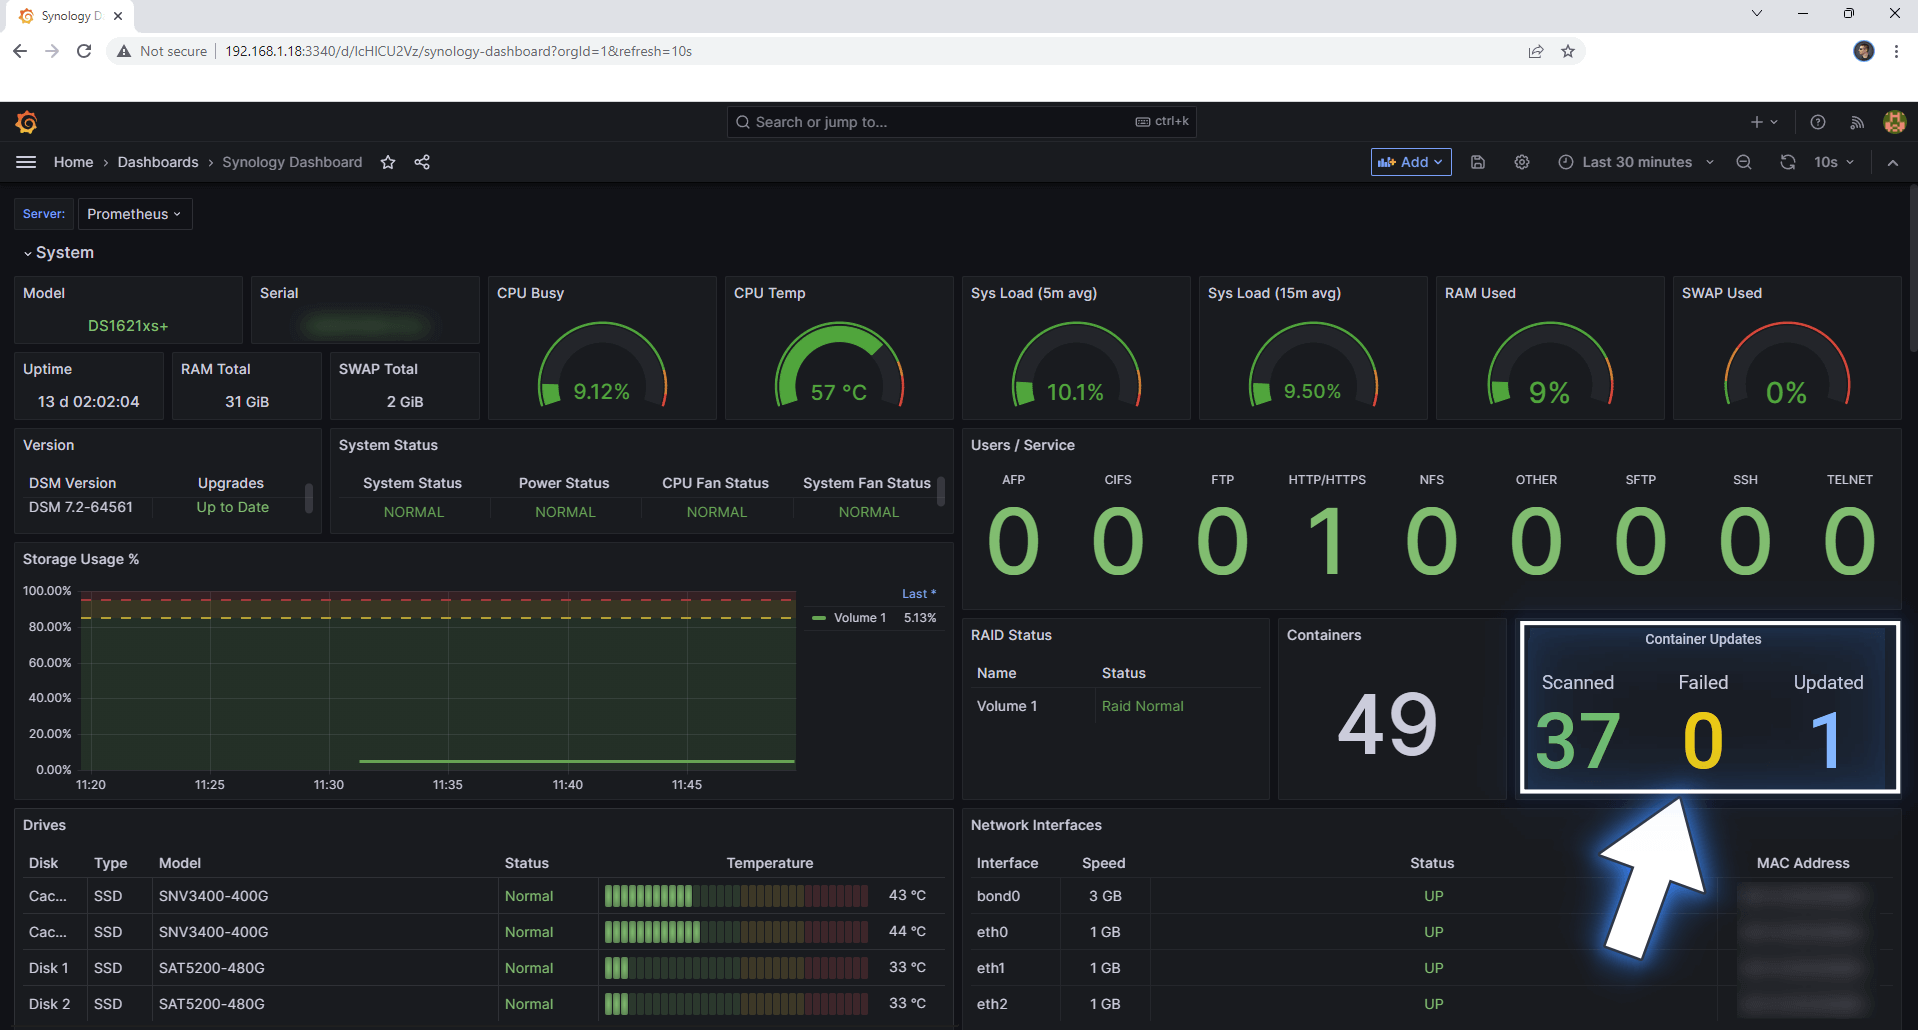
After the Prometheus container has restarted, go to your Synology Dashboard to see your metrics about Container Updates. Note: Know that the container updates metrics are not real-time metrics. The metrics take 10 minutes to show. For example, if you have set Watchtower to update and scan your containers every 2 hours (like in the example at STEP 6), then your metrics in the Grafana dashboard will appear every 2 hours and 10 minutes in the Container Updates area.
Note: Remember that you have to use this guide and install Watchtower on every Synology NAS device you want to monitor.
⚠️Warning: Watchtower will do upgrades of your docker containers automatically. This means that, if a docker image has a bug, it might destroy some containers you already have installed. For this reason, it is vital that you make Backups of your Docker folders using Hyper Backup.
Note: How to Back Up Docker Containers on your Synology NAS.
This post was updated on Friday / April 10th, 2026 at 12:42 AM