
Grafana is an open source visualization and analytics software. Grafana allows you to query, visualize, alert on and understand your metrics no matter where they are stored. Create, explore, and share dashboards with your team and foster a data driven culture. From heatmaps to histograms. Graphs to geomaps. Grafana has a plethora of visualization options to help you understand your data beautifully. After creating a dashboard like you do in getting started, there are many possible things you might do next. It all depends on your needs and your use case. For example, if you want to view weather data and statistics about your smart home, then you might create a playlist. In this step by step guide I will show you how to install Grafana on your Synology NAS using Docker. Note: If you want to monitor your Synology NAS via Grafana and Prometheus, check out my guide Monitor Your Synology With Grafana and Prometheus Dashboard.
STEP 1
Please Support My work by Making a Donation.
STEP 2
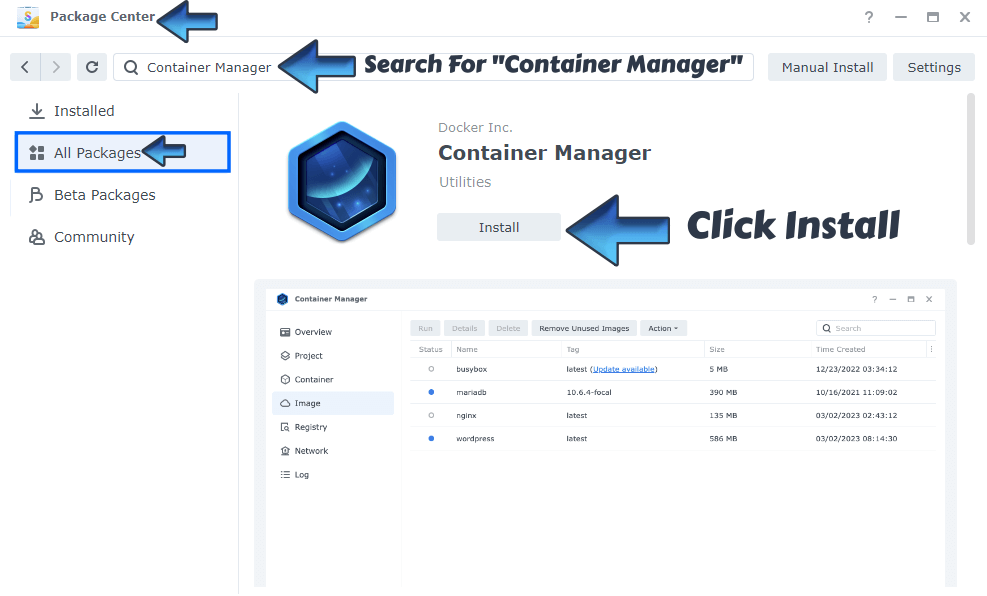
Install Container Manager via Synology “Package Center”. If you run an older DSM version (under 7.2), search for Docker instead of Container Manager.
STEP 3
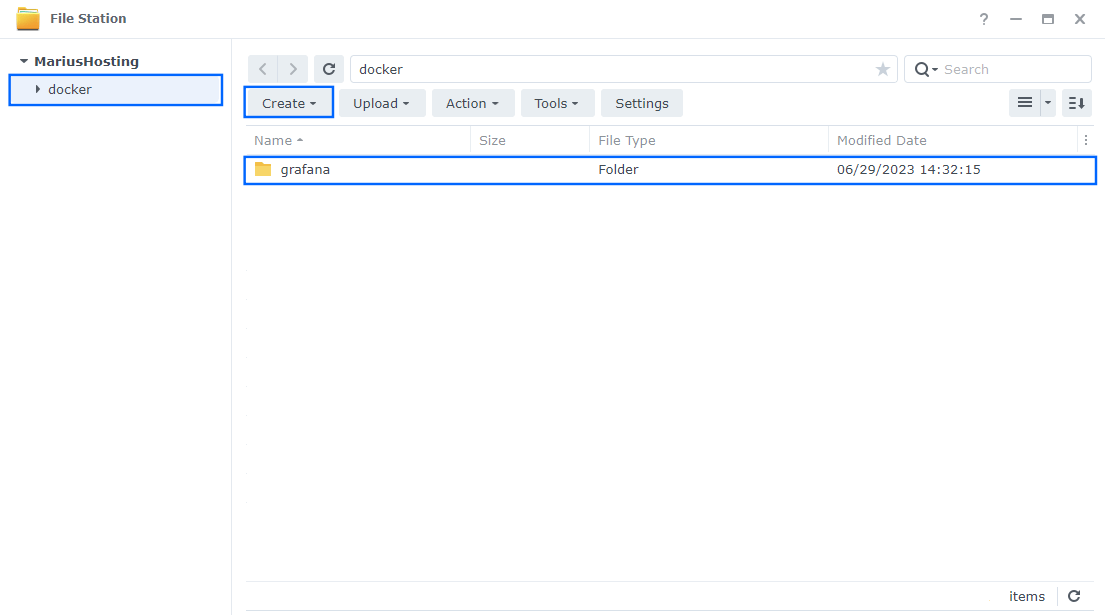
Go to File Station and open the docker folder. Inside the docker folder, create one new folder and name it grafana. Follow the instructions in the image below.
Note: Be careful to enter only lowercase, not uppercase letters.
STEP 4
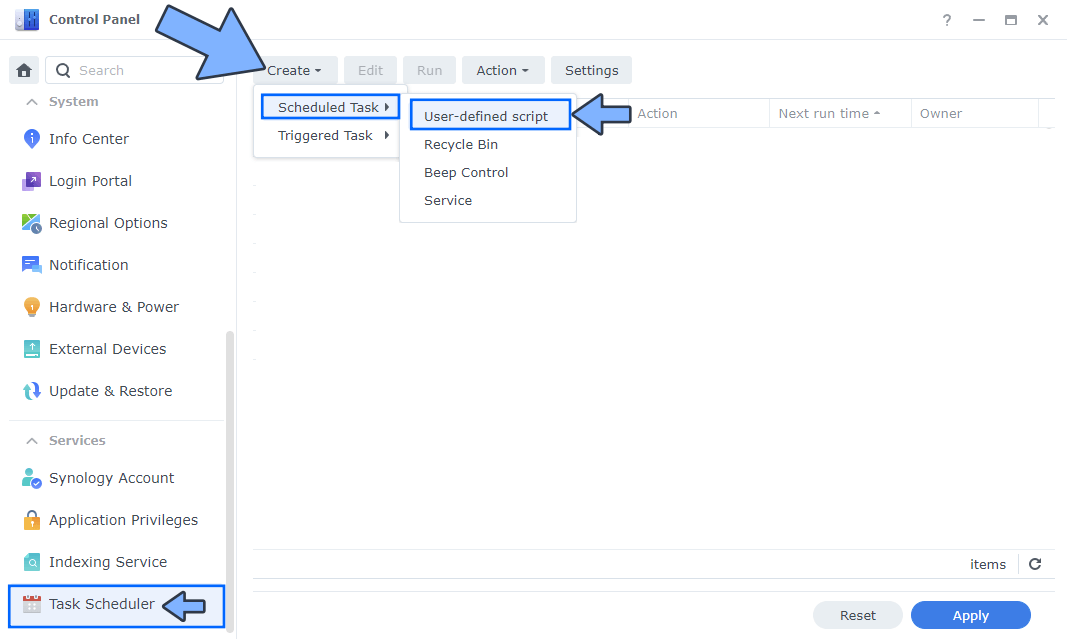
Go to Control Panel / Task Scheduler / Create / Scheduled Task / User-defined script. Follow the instructions in the image below.
STEP 5
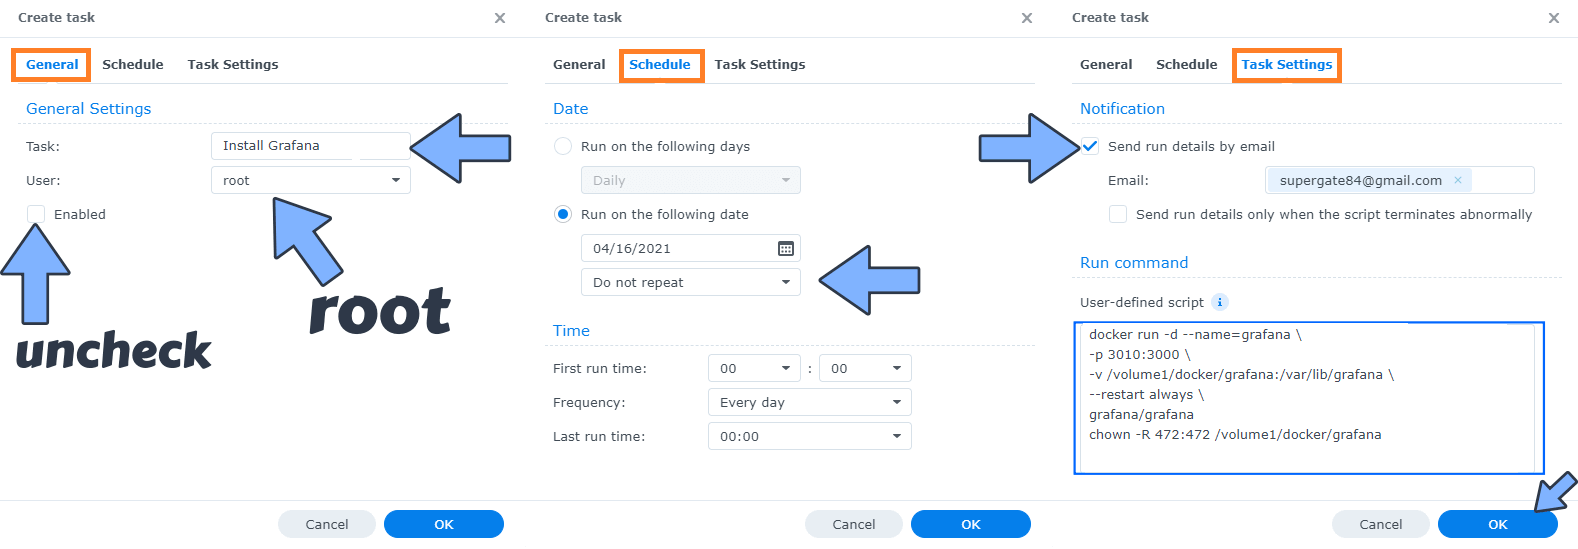
Once you click on User-defined script, a new window will open. Follow the instructions below:
- General: In the Task field type in “Install Grafana“. Uncheck the “Enabled” option. Select root User.
- Schedule: Select Run on the following date then select “Do not repeat“.
- Task Settings: Check “Send run details by email“, add your email then copy paste the code below in the Run command area. After that, click OK.
docker run -d --name=grafana \
-p 3010:3000 \
-v /volume1/docker/grafana:/var/lib/grafana \
--restart always \
grafana/grafana
chown -R 472:472 /volume1/docker/grafana
STEP 6
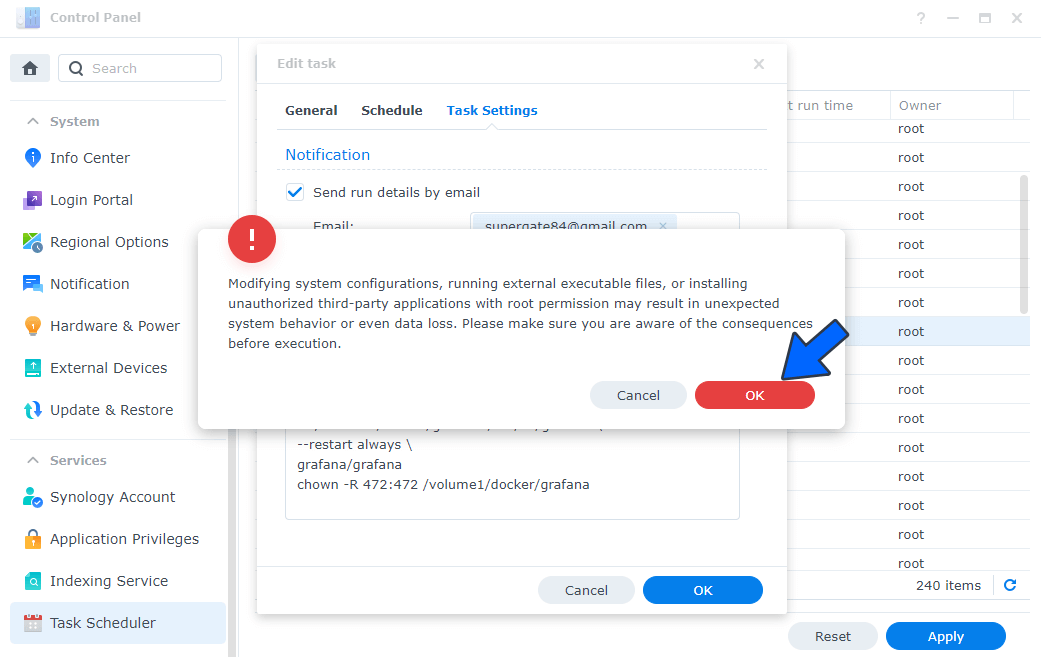
After you click OK on STEP 5 a new warning pop up window will open. Click OK.
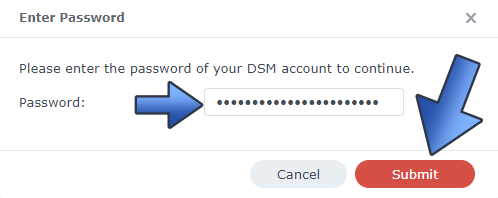
After you click OK, type in your DSM Password then click Submit. Follow the instructions in the image below.
STEP 7
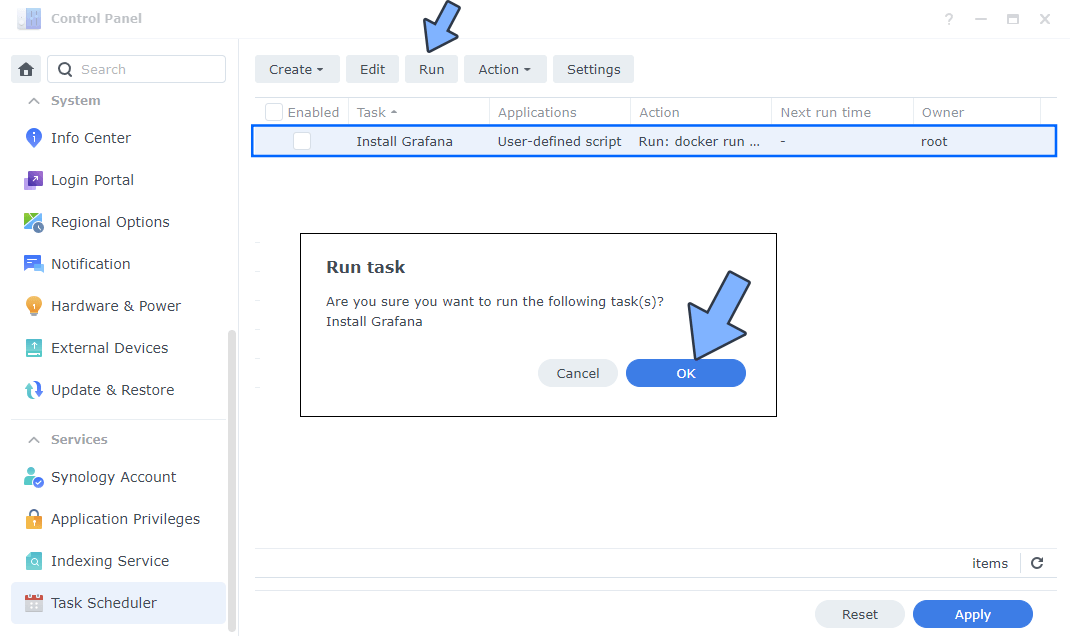
After you click Submit on STEP 6, select your “Install Grafana” Task then click the “Run” tab. You will be asked to run Install Grafana – click OK. Follow the instructions in the image below.
STEP 8
🟢Please Support My work by Making a Donation. Almost 99,9% of the people that install something using my guides forget to support my work, or just ignore STEP 1. I’ve been very honest about this aspect of my work since the beginning: I don’t run any ADS, I don’t require subscriptions, paid or otherwise, I don’t collect IPs, emails, and I don’t have any referral links from Amazon or other merchants. I also don’t have any POP-UPs or COOKIES. I have repeatedly been told over the years how much I have contributed to the community. It’s something I love doing and have been honest about my passion since the beginning. But I also Need The Community to Support me Back to be able to continue doing this work.
STEP 9
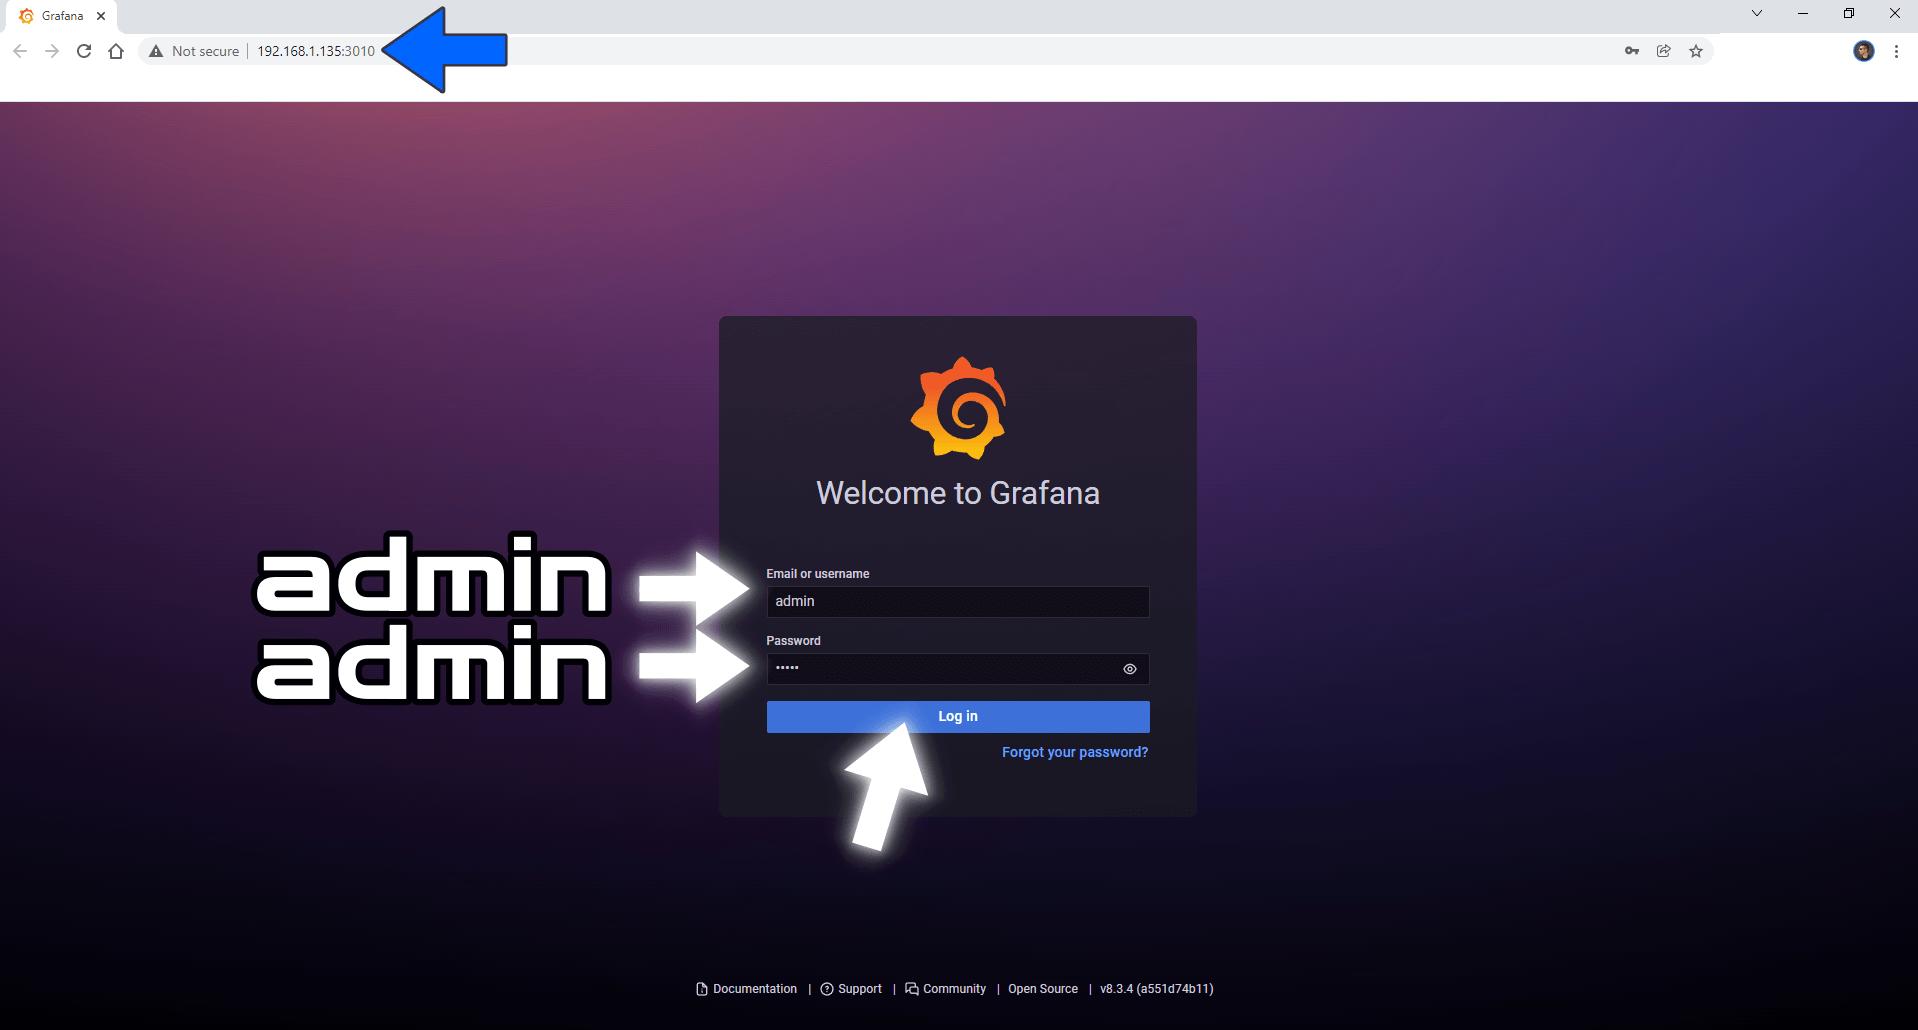
The installation process can take up to a few seconds/minutes. It will depend on your Internet speed connection. Now open your browser and type in http://Synology-ip-address:3010 Type in the default Username and Password, then click Log in.
STEP 10
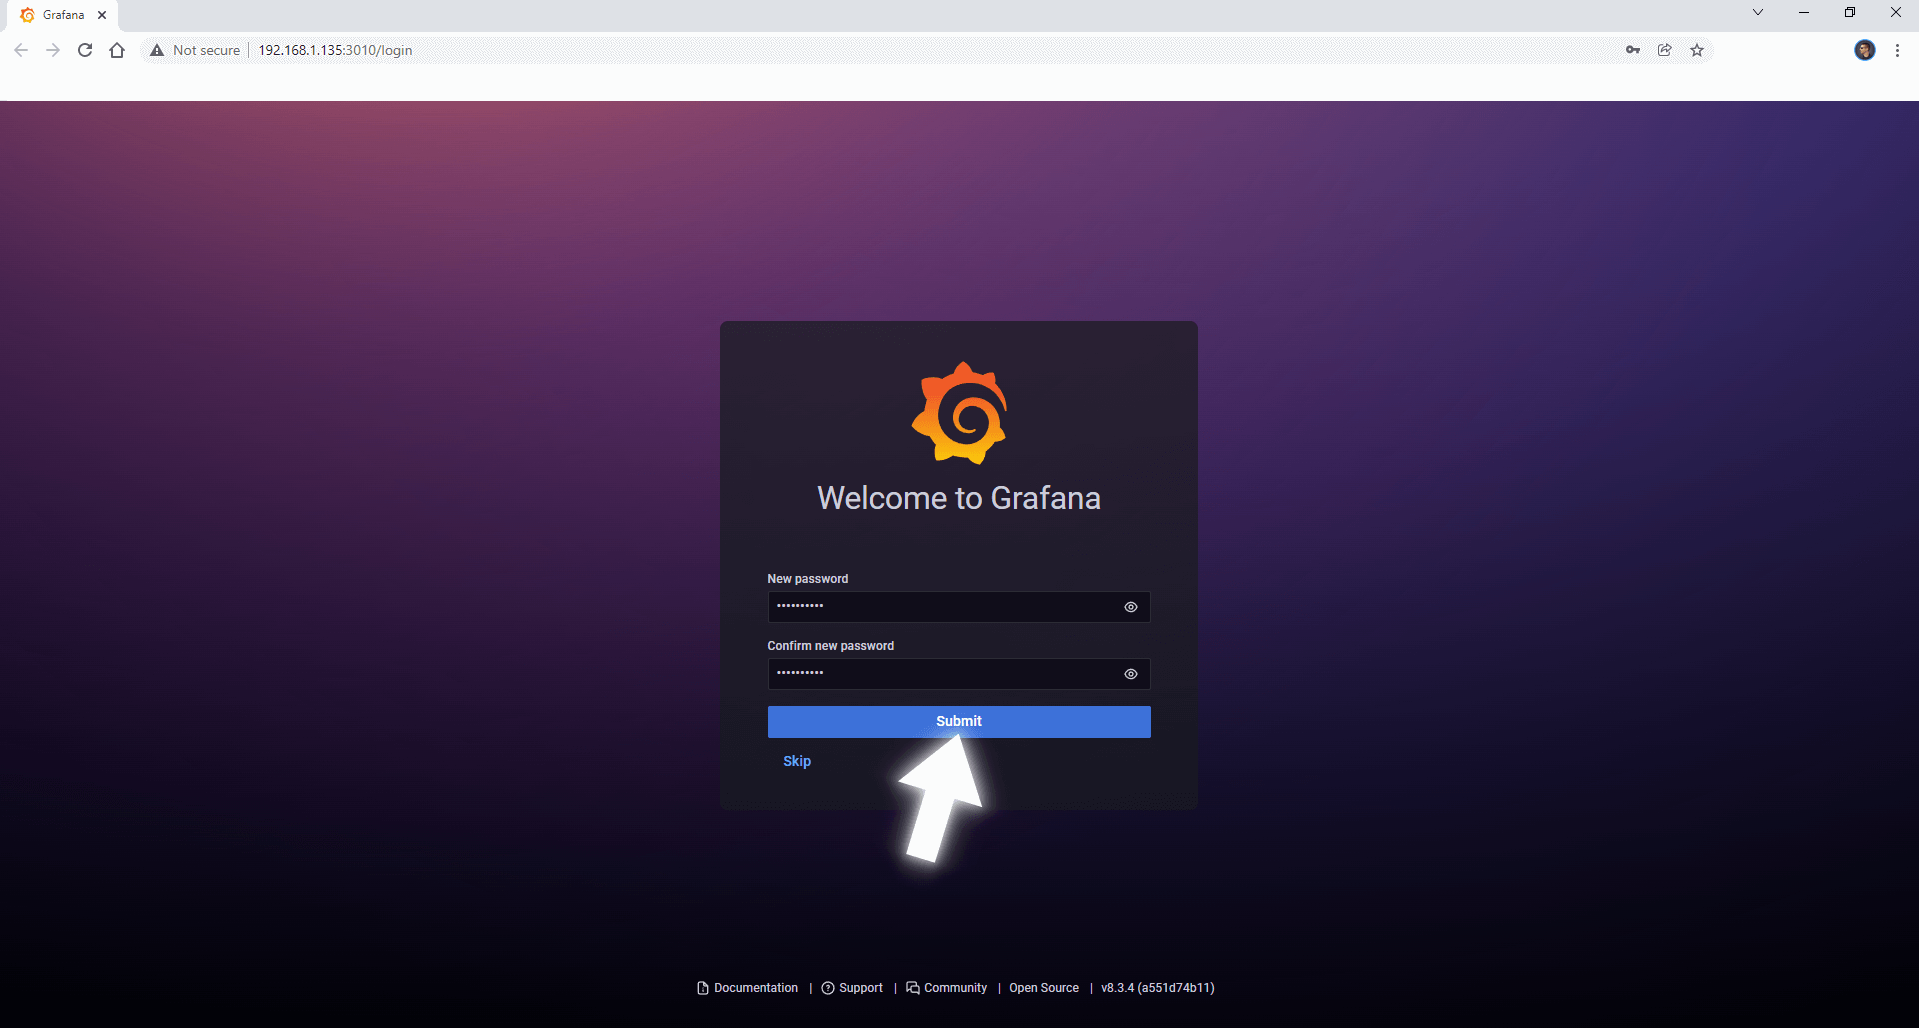
After you click Log in on STEP 9, you will be prompted to change the password. Choose your favorite password, then click Submit. Follow the instructions in the image below.
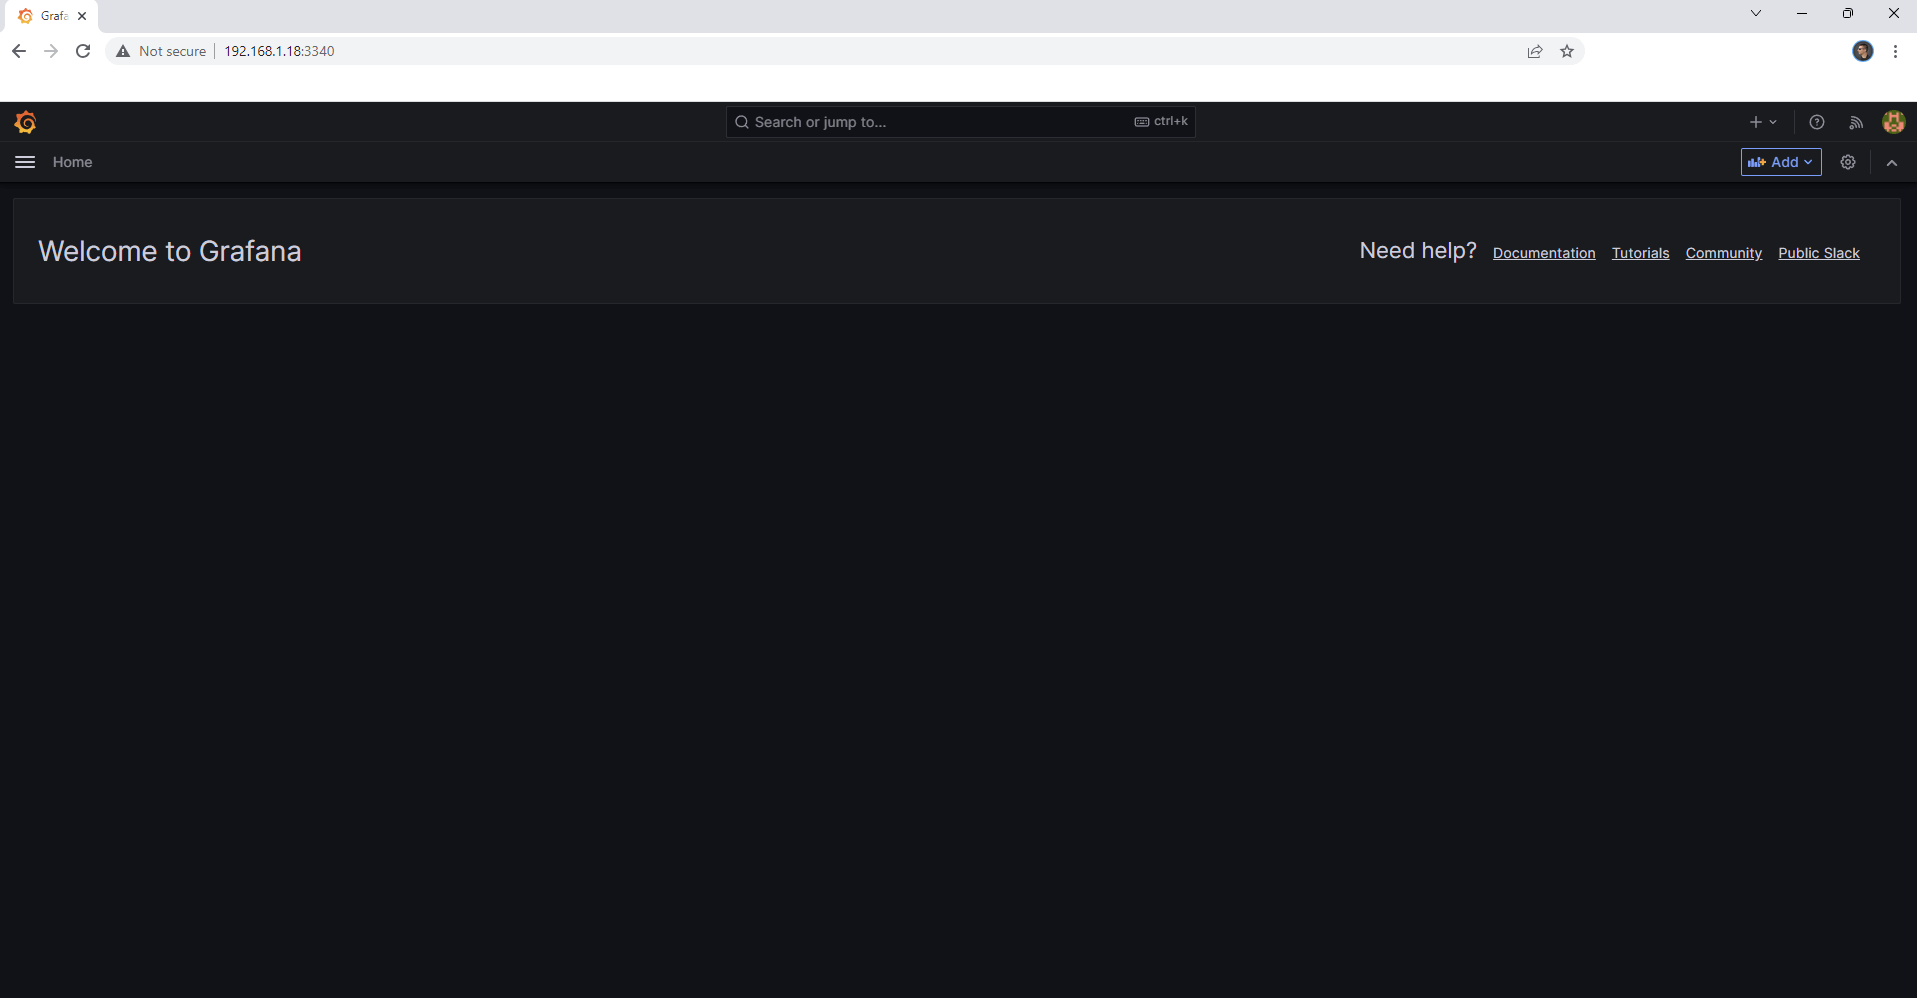
Enjoy Grafana!
Note: If you want to run the Grafana container over HTTPS, check out my guide on How to Run Docker Containers Over HTTPS.
Note: Can I run Docker on my Synology NAS? See the supported models.
Note: How to Back Up Docker Containers on your Synology NAS.
Note: Find out how to update the Grafana container with the latest image.
Note: How to Free Disk Space on Your NAS if You Run Docker.
Note: How to Schedule Start & Stop For Docker Containers.
Note: How to Activate Email Notifications.
Note: How to Add Access Control Profile on Your NAS.
Note: How to Change Docker Containers Restart Policy.
Note: How to Use Docker Containers With VPN.
Note: Convert Docker Run Into Docker Compose.
Note: How to Clean Docker.
Note: How to Clean Docker Automatically.
Note: Best Practices When Using Docker and DDNS.
Note: Some Docker Containers Need WebSocket.
Note: Find out the Best NAS Models For Docker.
Note: Activate Gmail SMTP For Docker Containers.
This post was updated on Friday / February 27th, 2026 at 11:19 AM
